Quantitative vs qualitative data: When to use each
Qualitative and quantitative data is key to uncovering valuable insights for your business. Understanding the purpose of both types of research, and how to go about collecting it can help you create a better respondant experience and, in turn, uncover more relevant insights.
Key Takeaways
- Quantitative measures, qualitative explains: Numbers tell you 60% of users abandoned checkout, but interviews reveal whether confusing form fields or unexpected shipping costs drove it.
- Match the method to your question: Use quantitative data to test a hypothesis or track change over time, and qualitative data when you're exploring a new topic and don't yet know what to ask.
- Sample size and timeline differ sharply: Quantitative research needs hundreds of respondents but deploys in days, while qualitative research reaches saturation around 15-23 interviews but takes weeks to recruit and analyze.
- The strongest insights combine both: Start with interviews to know what to ask, run a survey to measure how widespread it is, then follow up with interviews to explain any surprising results.
Data tells a story. But the story changes depending on which lens you use to read it.
Quantitative data speaks in numbers: percentages, averages, counts. Qualitative data speaks in words, themes, and context. Neither is complete without the other, and choosing the right one depends on what you're trying to learn.
What is quantitative data?
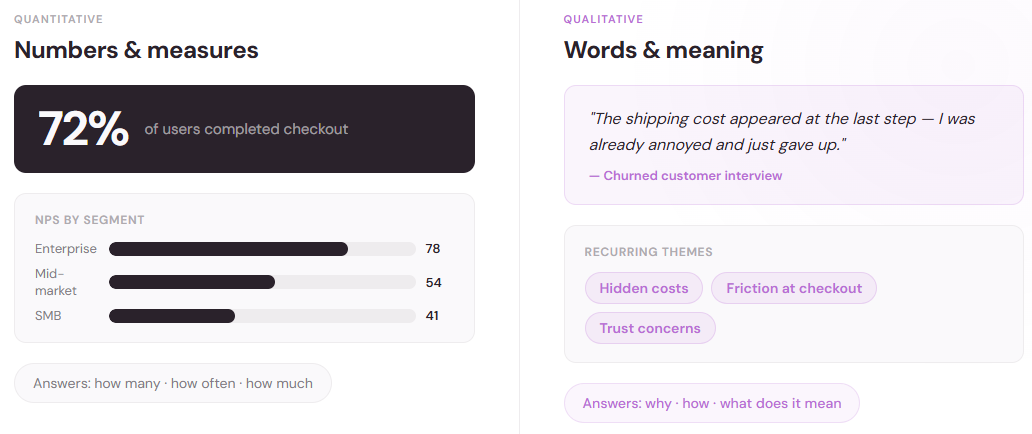
Quantitative data is numerical information that can be measured and analyzed statistically. It answers "how many," "how often," and "how much." Think of it as the hard numbers: survey response counts, conversion rates, revenue figures, customer satisfaction scores.
Quantitative data is structured and designed to test hypotheses or spot patterns across large groups. It scales well; you can survey 10,000 people and crunch the results into meaningful statistics.
Common sources of quantitative data include:
- Online surveys with rating scales or multiple-choice questions
- Website analytics and click tracking
- Sales figures and transaction data
- A/B test results and performance metrics
- Net Promoter Score (NPS) responses
What is qualitative data?
Qualitative data captures the texture of human experience: motivations, emotions, opinions, reasoning. It answers "why" and "how." Rather than reducing a response to a number, qualitative data preserves context and nuance.
Qualitative research methods include:
- In-depth interviews or focus groups
- Open-ended survey responses
- Customer feedback and testimonials
- Observational research
- Case studies and user testing sessions
A qualitative researcher listens for patterns in language, identifies recurring themes, and builds understanding from what people say and do. Where quantitative data says "60% of users abandoned the checkout," qualitative data might reveal why: confusing form fields, unexpected shipping costs, or trust concerns.
Qualitative data is harder to scale, but you gain richer insight into motivation and context.
Key differences between quantitative and qualitative data
Purpose and research questions
Quantitative data tests hypotheses and measures outcomes. You start with a theory and ask: "Is this true? To what extent?"
Qualitative data explores and discovers. You start with curiosity and ask: "What's happening here? Why?"
Sample size
Quantitative research demands larger samples for statistical power. A survey of 100 respondents is often a minimum; 500 or 1,000 is stronger.
Qualitative research uses smaller, intensive samples. Saturation is typically reached at 15–23 interviews.
Data type and analysis
Quantitative data is numerical and analyzed using statistics: averages, percentages, correlations, regression models.
Qualitative data is textual and analyzed through coding, thematic analysis, or narrative interpretation.
Timeline
Quantitative research deploys and analyzes quickly. Online surveys rank as the most used quantitative method, with 85% of market research professionals using them regularly.
Qualitative research takes longer due to recruitment, interviews, transcription, and coding.
When to use quantitative data
Choose quantitative data when you need to:
Measure prevalence or scale: Know how common a behavior, opinion, or problem is across a population. Quantitative data answers "What percentage of customers would recommend us?" or "How many users experience friction at checkout?"
Test a specific hypothesis: You have a theory and want statistical evidence.
Benchmark and track change over time: Compare performance across periods or segments to show if satisfaction improved.
Make confident business decisions quickly: Quantitative surveys can be deployed, analyzed, and reported in a week.
Segment audiences or predict behavior: Divide your customer base into groups or predict future actions.

When to use qualitative data
Choose qualitative data when you need to:
Understand the "why" behind behaviors: A metric like high bounce rate doesn't reveal what's driving it. Qualitative research uncovers the reasoning and emotions behind the number.
Explore a new or emerging topic: You don't yet know what questions to ask. Open-ended research helps you discover categories and themes.
Capture nuance and emotion: Some insights can't be reduced to a rating scale. Frustration, brand perception, or emotional impact require rich, textual data.
Validate or explain quantitative findings: Your survey shows 40% prefer the new design. Follow-up interviews reveal why.
Build empathy and align teams: A customer quote carries emotional weight that a percentage cannot. Qualitative insights help teams connect with customer needs.
Test user experience or prototype concepts: Usability testing reveals friction points that surveys would miss.
Combining quantitative and qualitative data
The most complete picture emerges when you use both. Here’s a typical workflow:
Start with qualitative research to explore: Interview customers to understand their world and identify what matters most. This prevents you from asking the wrong questions in a quantitative survey.
Design and deploy quantitative research to measure: Armed with qualitative insight, create a survey or experiment that tests specific hypotheses and measures how common themes are.
Use qualitative follow-ups to explain quantitative results: When data shows an unexpected pattern, dig back in with interviews to understand what's driving it.
For example: You notice churn is up in a segment (quantitative finding). You interview churning customers and discover a recent feature change created friction for power users (qualitative exploration). You run a follow-up survey with all power users to confirm scope (quantitative validation). You redesign the feature and measure impact (quantitative outcome).
Data quality matters regardless of approach. Organizations often struggle: 61% report data inconsistency issues that impact decision-making, and only about 30% of organizational data is considered high-quality and reliable.

Practical tips for choosing between them
When designing your next research project, ask yourself:
What's my core question? "How many people feel X?" → Quantitative. "Why do people feel X?" → Qualitative.
How much time do I have? Weeks → Quantitative survey. Months → Qualitative study or both.
What will I do with the answer? Setting targets or comparing segments → Quantitative. Redesigning features or building empathy → Qualitative.
Is this exploratory or confirmatory? Exploratory → Qualitative. Confirmatory → Quantitative.
Who needs to understand the insights? Executives often respond to numbers. Product teams need rich context and customer voice.
Key takeaway
Quantitative data proves something is true and how much it matters. Qualitative data explains why. Organizations that understand their customers most deeply use these approaches strategically: quantitative research to measure across a full audience, and qualitative research to understand in depth.
Get clear on what you're trying to learn, then choose the data type that answers that question most efficiently. When stakes are high, combine them for a fuller, more actionable understanding of your audience.

.png)