Nominal vs ordinal data: What's the difference
Deciding to use nominal vs. ordinal data for your market research? Learn about the ordinal scale, nominal scale, ordinal and nominal data examples, and more.
Key Takeaways
- Nominal data has no natural order: Categories like favorite color or job title are simply different, not ranked.
- Ordinal data has a built-in progression: Options like satisfaction ratings or education level move from lower to higher, so the order carries meaning.
- The type of data determines what analysis you can run: You can find the mode for nominal data, but only ordinal data supports a median or rank-based tests like Spearman's correlation.
- Ask "can I rank these meaningfully?" to tell them apart: If yes, treat the data as ordinal; if ranking feels arbitrary, treat it as nominal.
Data comes in different flavors. Some of it is just categories with no ranking. Some of it has a clear order. And some of it is pure numbers you can actually do math with.
If you're collecting feedback, running a survey, or analyzing customer responses, you need to know which type of data you're working with. That's because the type determines what you can do with it: what questions you can answer, what analysis makes sense, and how reliable your conclusions will be.
This guide explains nominal and ordinal data, shows you the practical difference, and helps you recognize which one you're dealing with.
What is nominal data?
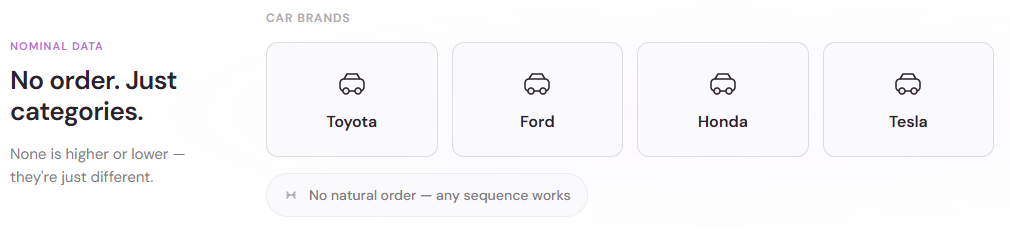
Nominal data puts things into categories with no natural order. The categories are just labels. There's no "first" or "best." They're all equal.
Think of favorite colors. Red isn't higher or lower than blue. They're just different. Same with car brands, countries, job titles, or gender. These are all nominal—pure categories, nothing ranked.
When you collect nominal data, you're asking "which one?" not "how much?" or "how good?"
Examples of nominal data
- Food preferences: pizza, tacos, sushi, burgers
- Marital status: single, married, divorced, widowed
- Employment type: full-time, part-time, freelance, contract
- Geographic location: North America, Europe, Asia, South America
- Product type: laptop, tablet, smartphone, desktop
None of these has a natural sequence. You can't say sushi is "more" than pizza, or that Europe ranks above Asia. They're just different categories.
What is ordinal data?
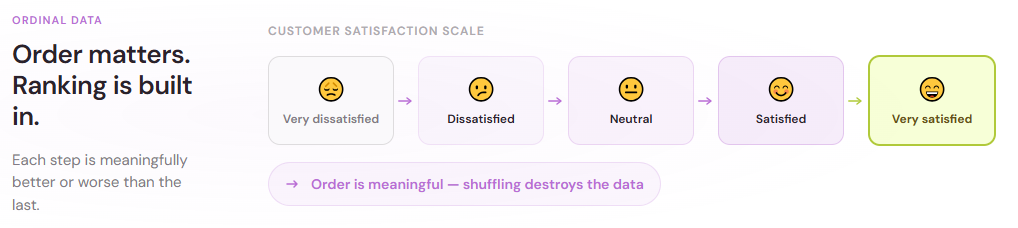
Ordinal data puts things into categories with a natural order. There's a ranking or sequence, a clear progression from lower to higher, or worse to better.
Customer satisfaction is a classic example. "Very dissatisfied" comes before "dissatisfied," which comes before "neutral," and so on. There's a real progression. You can compare them meaningfully.
Same with education level (high school, bachelor's, master's, PhD), income brackets (under $25k, $25k–$50k, $50k–$100k), or agreement scales (strongly disagree, disagree, neutral, agree, strongly agree).
Examples of ordinal data
- Satisfaction ratings: very satisfied, satisfied, neutral, dissatisfied, very dissatisfied
- Agreement scales: strongly agree, agree, neutral, disagree, strongly disagree
- Frequency: never, rarely, sometimes, often, always
- Performance levels: poor, fair, good, very good, excellent
- Education attainment: high school, associate degree, bachelor's degree, master's degree, doctoral degree
In each case, there's a clear progression. "Very satisfied" is better than "satisfied." "Always" happens more than "rarely." The order matters.
The key difference: order matters
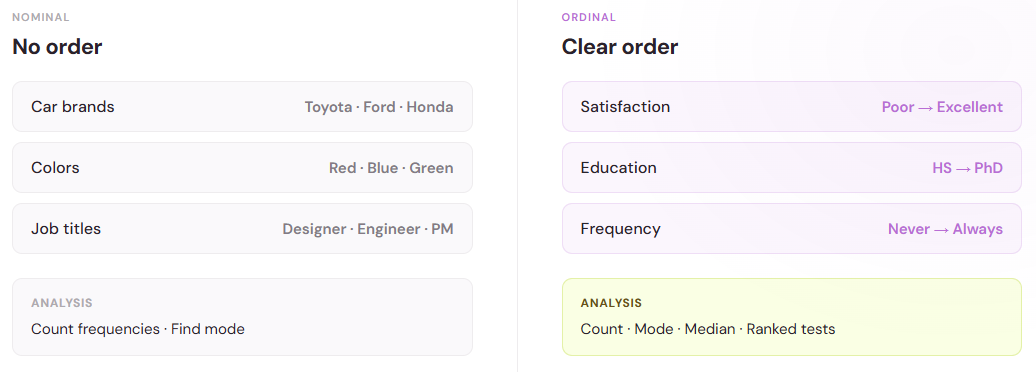
Here's the core distinction: nominal data has no order. Ordinal data does.
If you shuffled the options in a nominal question—say, listing "tacos" before "pizza"—nothing changes about the data. They're still just categories.
But if you shuffled an ordinal question—putting "agree" before "strongly disagree"—you'd confuse your respondents. The order is part of the meaning.
This matters because:
- Analysis changes: You can't calculate the average color or the median country. But you can work with ordinal data in more ways. You can spot trends, compare groups, and identify which ratings are most common.
- Visualizations differ: Nominal data works well in bar charts or pie charts. Ordinal data benefits from scales that show the progression.
- Statistical tests vary: Some tests only work on ordinal data. Others ignore the order entirely and treat ordinal data as nominal.
How to spot the difference in surveys
When you're designing a survey or analyzing responses, ask yourself: Is there a natural progression?
If yes, it's ordinal. If no, it's nominal.
- "Which social media platform do you use?" — No natural order. Nominal.
- "How often do you check social media?" — Clear progression (never, rarely, sometimes, often, always). Ordinal.
- "What's your job title?" — No order. Nominal.
- "What's your education level?" — Clear progression. Ordinal.
- "What's your favorite cuisine?" — No order. Nominal.
- "Rate your experience on a scale of 1–5." — The numbers have a progression. Ordinal.
When uncertain, ask: "can I rank these meaningfully?" If yes, it's ordinal. If ranking feels wrong or arbitrary, it's nominal.
Why this matters for your data analysis
Knowing the difference affects what you can do with your data.
With nominal data:
You can count frequencies and find the mode (the most common category). You can also do chi-square tests to see if there's a relationship between two nominal variables. But calculating an average doesn't make sense.
With ordinal data:
You can count frequencies and find the mode. You can also calculate the median (the middle value when ranked) and use ordinal-specific tests like the Mann-Whitney U test or Spearman's correlation to compare groups. Averages are trickier with ordinal data, as the intervals between ranks aren't always equal.
If you treat ordinal data as if the gaps are equal, your analysis can lead you astray.
Collecting nominal and ordinal data in practice
For nominal data:
Use multiple-choice questions where the order doesn't matter.
- "Which of these best describes your role?" (Manager, Individual contributor, Executive, Other)
- "What's your preferred contact method?" (Email, Phone, SMS, In-app notification)
Keep options balanced and representative of your audience.
For ordinal data:
Use ranking or scale questions where order is clear.
- "How satisfied are you with your purchase?" (Very dissatisfied to Very satisfied)
- "How often do you use this feature?" (Never, Rarely, Sometimes, Often, Always)
Make sure your scale is balanced with equal numbers of positive and negative options and a neutral middle. Label the extremes so respondents understand the progression.
Nominal, ordinal, and beyond
These aren't the only data types. There's also interval data (like temperature) and ratio data (like income or weight). But nominal and ordinal are the foundation. Understanding them makes everything else clearer.
The bottom line: nominal data is just categories. Ordinal data is categories with a built-in order. Know which one you have, and you'll ask the right questions, do the right analysis, and reach more reliable conclusions.


.png)