Diagnostic analytics: What it is, how it works, and why it matters
Diagnostic analytics reveals why a trend happened, not just what. Learn how it works, key techniques, and why it drives long-term growth.
Diagnostic analytics is the process of examining data to determine why something happened. It builds on descriptive analytics by identifying root causes, correlations, and patterns behind changes in performance.
Many things in life involve luck. Whether you get a parking spot in the city on a Friday night. The lottery. The games at a carnival. Marketing, however? It’s a science, and you can’t launch a campaign and cross your fingers, hoping for the best. So let’s take a look at diagnostic analytics, how it works, and the “why” behind it all.
Key takeaways
- Diagnostic analytics explains why something happened. It builds on descriptive analytics to uncover the factors behind changes in business and marketing performance.
- Effective analysis follows a structured process. Start with a clear objective and reliable data, test hypotheses, and turn validated findings into actionable recommendations.
- Multiple techniques help uncover root causes. Segmentation, drill-down analysis, hypothesis testing, and regression help teams investigate performance changes.
- Correlation does not prove causation. Testing assumptions and considering outside influences help prevent misleading conclusions.
- Understanding the “why” supports long-term growth. Teams can address underlying problems, repeat successful strategies, reduce waste, and make informed decisions.
What is diagnostic analytics?
Diagnostic analytics is a method that goes beyond the basic reporting a typical dashboard provides to examine why events, behaviors, and outcomes occurred. It’s meant to uncover root causes and relationships within your data. Dashboards show you changes in click-through rates (CTR), bounce rates, or Cost Per Acquisition (CPA), but diagnostics ask what behavior drove those numbers.
As this article by Harvard Business School notes, “Diagnostic analysis can be done manually, using an algorithm, or with statistical software (such as Microsoft Excel).”
An example of when to use diagnostic analytics is included in this LinkedIn article, written by data analytics expert Mohamed Amin:
Your descriptive analytics dashboard clearly shows what happened:
- Overall revenue: Down 18%
- Customer acquisition: Down 12%
- Average order value: Down 8%
- Customer retention: Down 15%
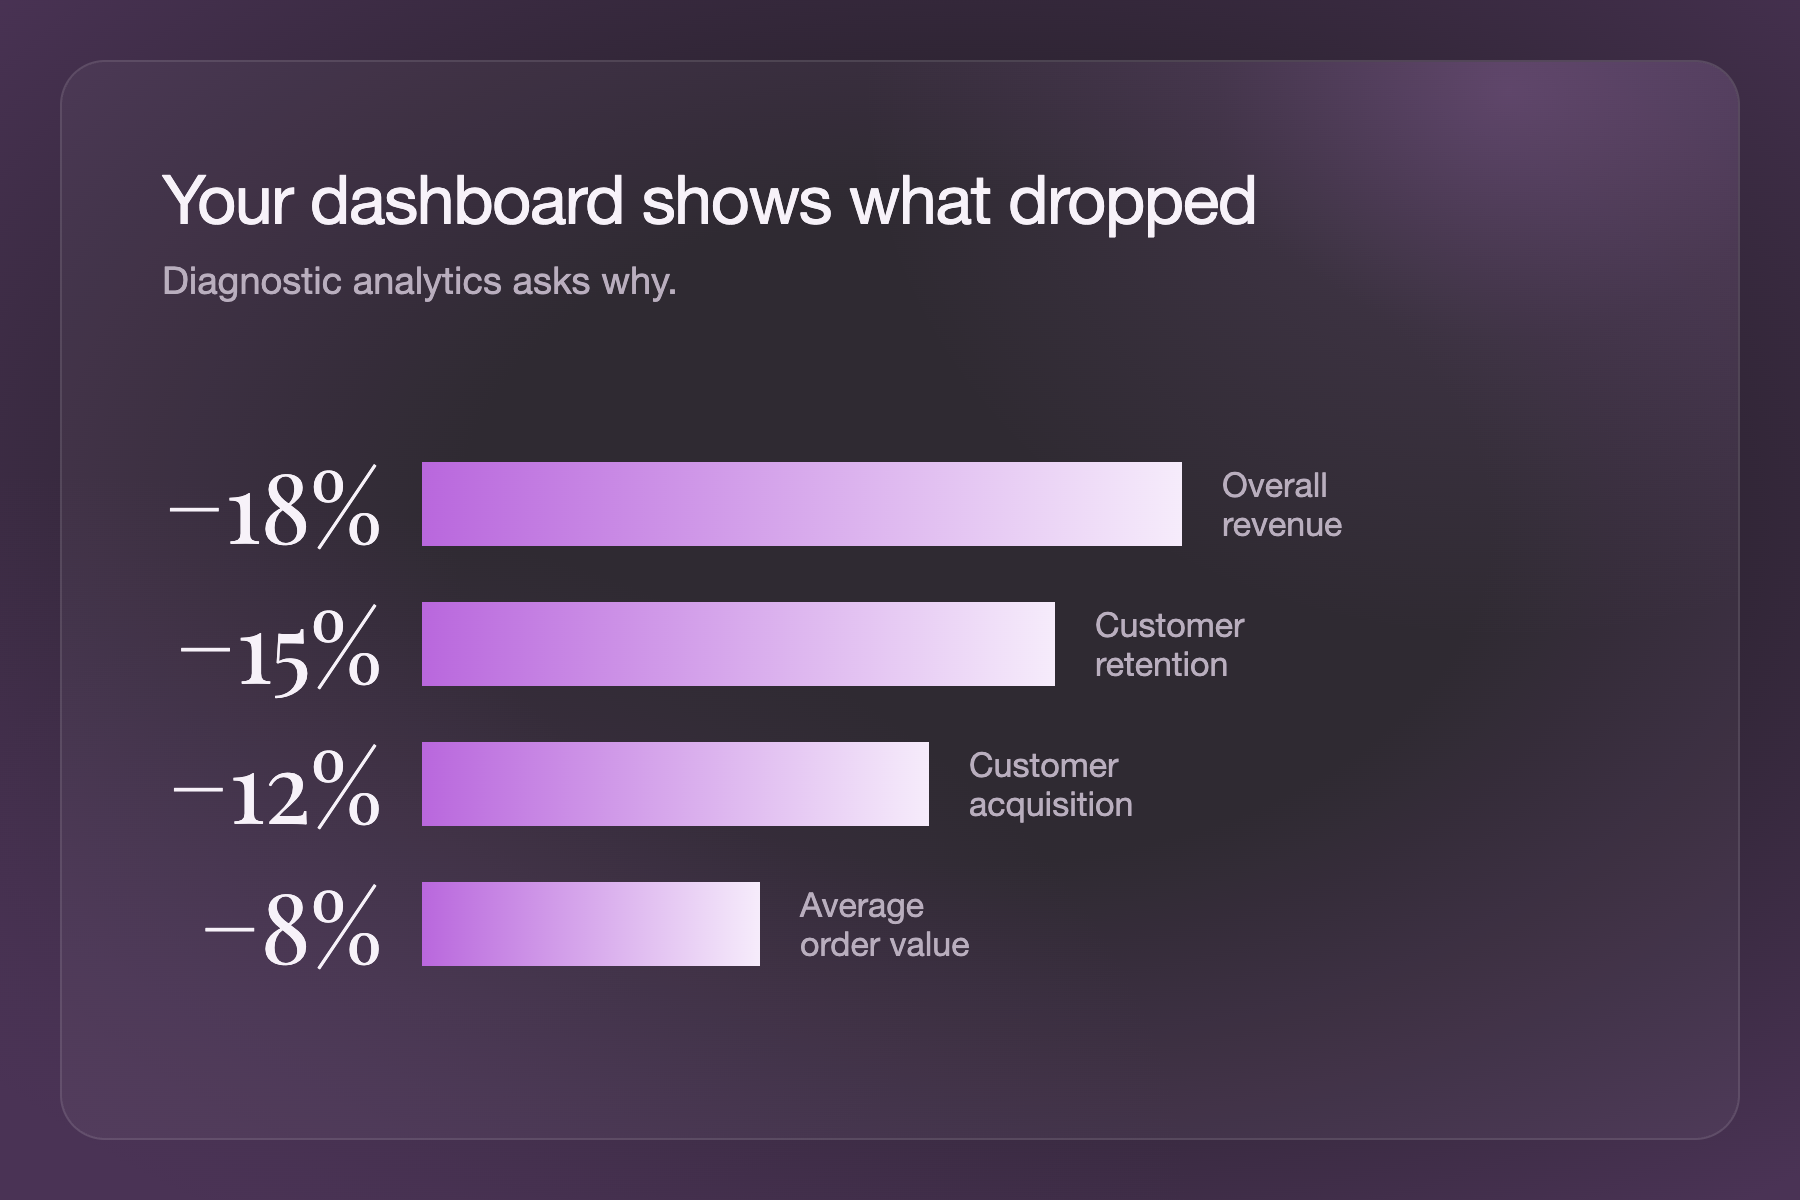
“You now have perfect clarity on the problem. But you're stuck on the most critical question: Why?”
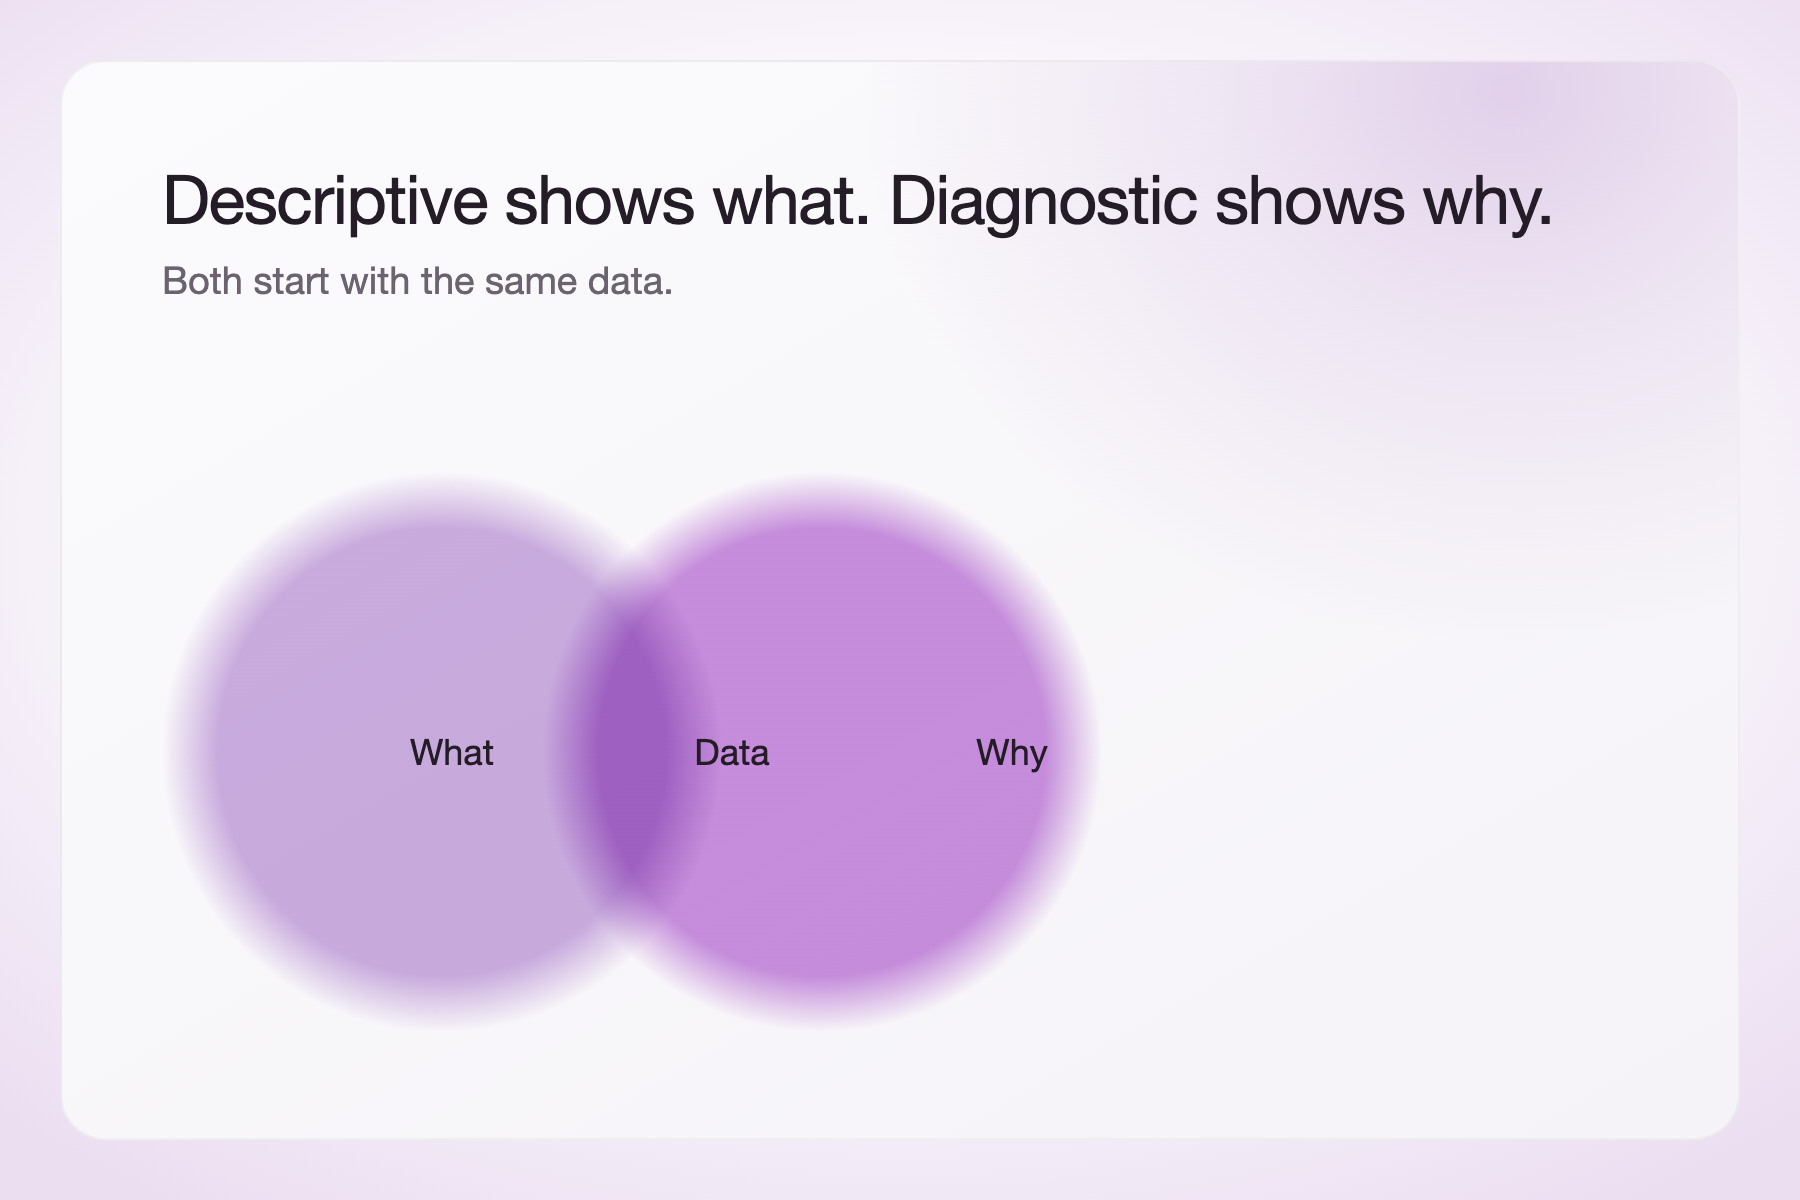
Diagnostic analytics fills the chasm between knowing what happened (descriptive analytics) and forecasting outcomes (predictive analytics).
What is the purpose of diagnostic analytics?
Diagnostic analytics seeks to reveal the elements that led to particular results. These insights add context and detail to the data, helping you make more precise choices by fully understanding influencing factors. You might use diagnostic analytics to meet several goals, combining it with other data science methods for a macro view of your business.
Diagnostic analytics serves several key purposes:
- Problem solving: examining historical data to answer why an event, anomaly, or failure occurred by uncovering its root causes as opposed to treating its symptoms. It fills in the gap between knowing what happened (descriptive analytics) and understanding why it happened.
- Data validation: verifying data quality and integrity so researchers do not mistake measurement errors for system anomalies
- Risk management: the process of using root-cause investigation, variance analysis, and correlation testing to answer why a risk event, control failure, or operational breakdown happened” (MetricStream)
- Performance improvement: using data and root-cause investigation to figure out why operational or business performance dropped or succeeded, and then fixing any underlying issues
At its core, diagnostic analytics goes beyond reporting surface metrics. Separating correlation from causation is a necessary part of this. Testing whether a marketing spike was the direct result of an ad campaign or, instead, influenced by external factors will be necessary information to decide how to proceed.
How does diagnostic analytics work?
Diagnostic analytics follows a systematic process that transforms raw data into actionable insights. As you proceed, you can refine your hypotheses, perform additional tests, or go down the rabbit hole that is your current data to gain a better understanding of it.
Phase 1: Setup and planning, which includes defining your objective and removing any inconsistencies in your data
Phase 2: Analysis and discovery, which includes exploring the data, forming hypotheses, and validating or disproving theories
Phase 3: Insights and action, which includes identifying root causes, validating your findings, and making appropriate recommendations for next steps based on said findings
4 types of data analytics
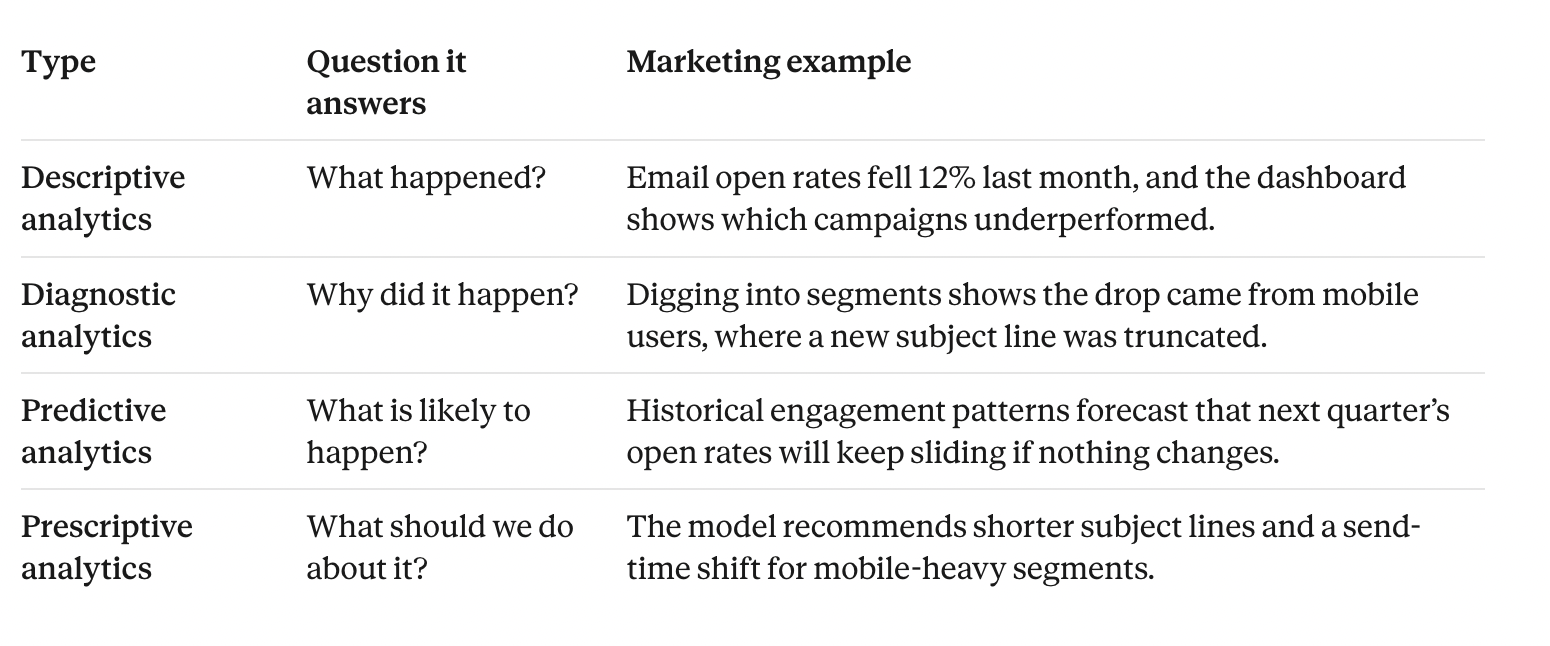
Diagnostic analytics is one of the four types of data analytics, each designed to answer a specific question:
Diagnostic analytics examples
Using diagnostic analytics involves applying several techniques. You’ll likely use a combination of techniques to deepen your understanding of the data, give you a better picture, and reach a solid conclusion.
Practical examples of where you might apply diagnostic analytics:
Hypothesis testing
This means that you create a hypothesis and test it against the available evidence to help you validate or reject assumptions about relationships between data (e.g., A/B testing—a form of hypothesis testing).
Correlation vs. causation
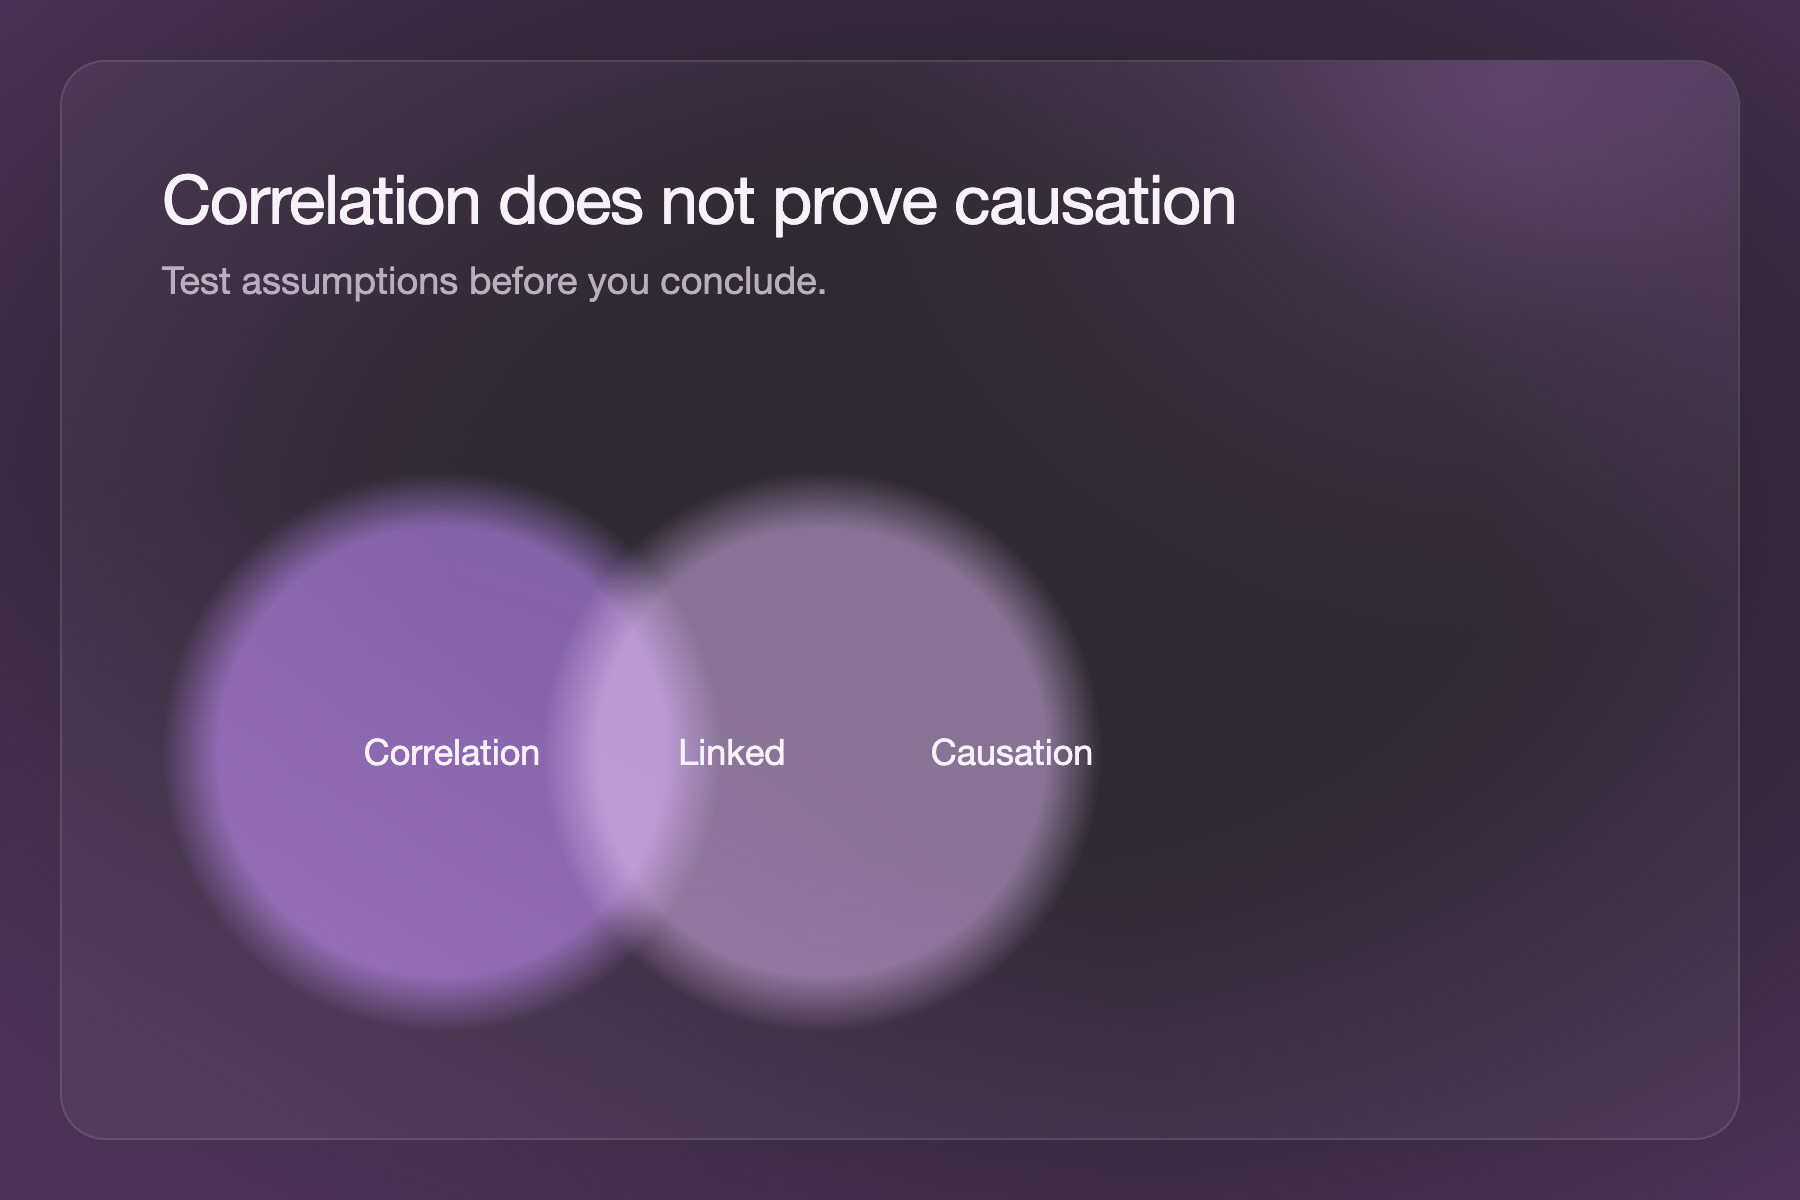
Correlation is a statistical relationship between two variables, whereas causation implies that changes in one variable directly cause changes in another.
Diagnostic regression analysis
This technique measures how strongly different variables relate to an outcome and checks for unusual data points that could skew the results.
Pros and cons of diagnostic analytics
As with most marketing campaign analyses, there are positives and negatives to diagnostic analytics. By examining these, you can get a better understanding of its impact on your marketing success.
What are the benefits of diagnostic analytics?
With diagnostic analytics, you can determine why certain events happened and fix the main problems causing them. When you understand why things happened, you can adjust your plans accordingly. These insights can solve problems, improve processes, and minimize risk.
What are the disadvantages of diagnostic analytics?
As advantageous as diagnostic analytics is in the long run, it can also pose certain challenges, such as analysis accuracy, analytical limitations, data complexity (e.g., large datasets), and the requirements necessary (tool costs, training needs, etc.).
Why diagnostic analytics matters for long-term business success
Finally, we’ve come to the most important part: the why. Understanding what happened is helpful, but knowing why it happened is critical. Once you know this, your team will be able to make smarter, swifter decisions.
Instead of guessing why engagement or sales took a dip last month, you can identify the root cause. This clarity helps you fix the issue, maximize what works, and prevent wasted time in the future. Diagnostic analytics allows you to go from reactivity to proactivity and, in turn, data-driven, informed growth.
Diagnostic analytics FAQs
Is diagnostic analytics the same as root cause analysis?
Not exactly. Root cause analysis (RCA) is a broader problem-solving method used in fields like manufacturing, healthcare, and IT, often with techniques such as the “5 Whys.” Diagnostic analytics is the data-driven approach to finding why a trend occurred, using segmentation, hypothesis testing, and regression. The two overlap, and diagnostic analytics often supports RCA.
What are examples of diagnostic analytics?
Examples of diagnostic analytics include investigating why conversions dropped after a website redesign, why one email segment’s open rate fell while others stayed steady, and why a paid campaign’s cost per acquisition spiked. Marketers use drill-down analysis, A/B testing, correlation analysis, and regression to pinpoint the cause.
- Website redesign: Compare conversion rates by device and page to find that the new checkout flow breaks on mobile.
- Email performance: Segment by audience and device to learn that a long subject line was truncated for mobile readers.
- Paid advertising: Break CPA down by audience, placement, and time period to discover that a competitor’s promotion raised bids during your peak hours.
- Revenue decline: Separate traffic, conversion rate, and average order value to see which one actually drove the drop, like the scenario in the LinkedIn example above.
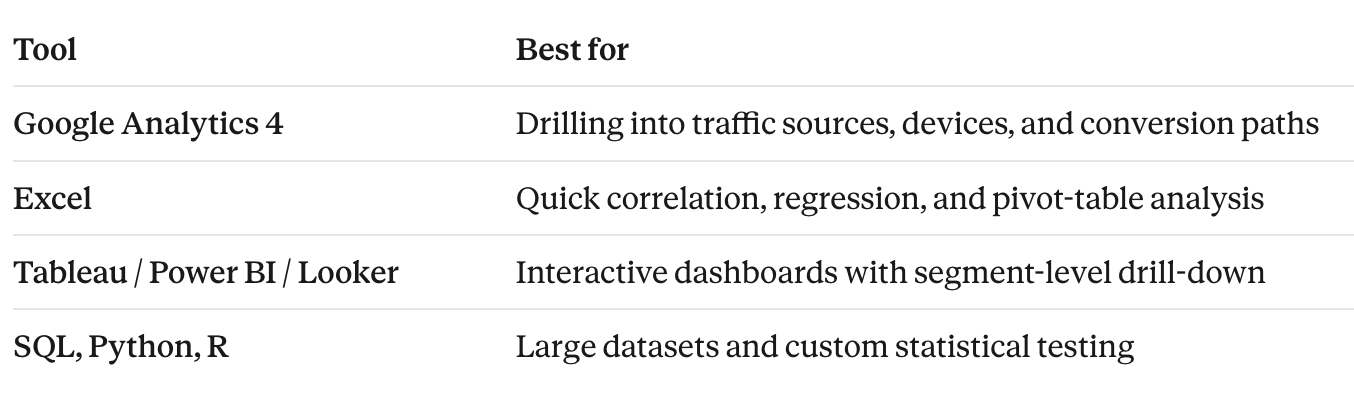
What tools are used?
GA4, Excel, Tableau, Power BI, Looker
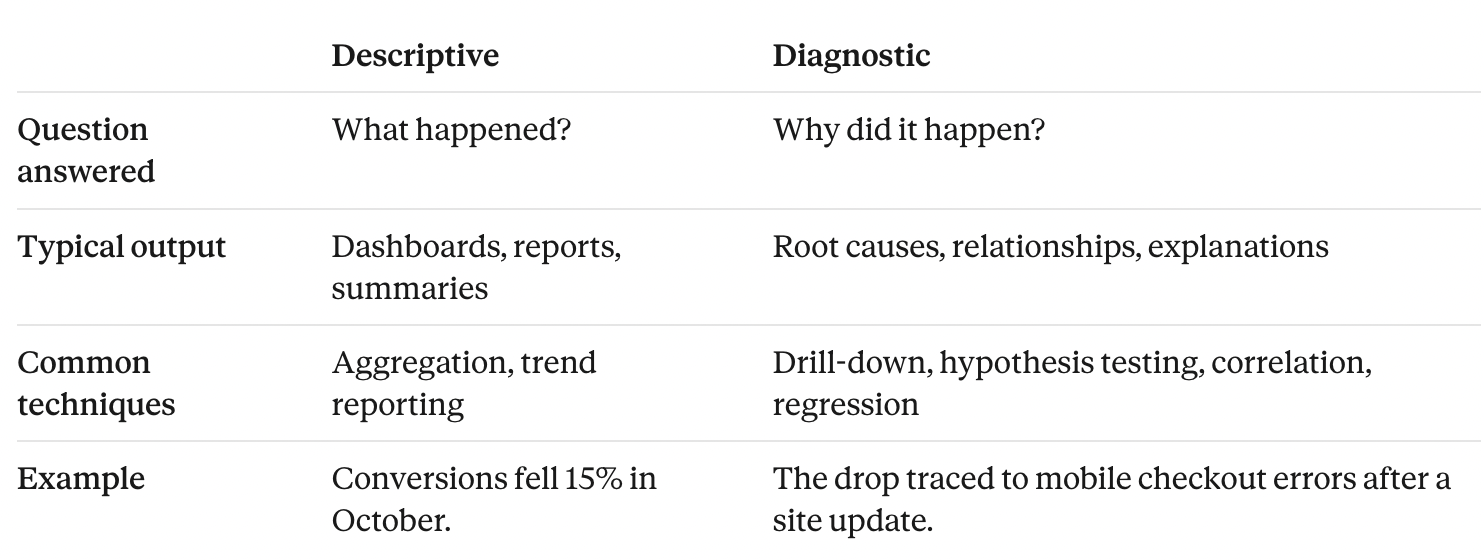
What’s the difference between descriptive and diagnostic analytics?
Descriptive analytics summarizes historical data to show what happened, such as a drop in click-through rate or a rise in cost per acquisition. Diagnostic analytics goes a step further and investigates why it happened, using techniques like drill-down analysis, segmentation, and correlation to identify the root cause behind the change.
Turn data into decisions that drive growth
Diagnostic analytics helps you better understand your operations and outcomes. You can move beyond surface-level observation and address any issues at their root, reducing guesswork in decision-making and allowing for informed decisions. With insight into causal relationships, you can create more accurate and adaptable plans and focus resources on the areas that drive the most impact on your bottom line.