Competitive benchmarking: a guide for marketing teams
Competitive benchmarking puts your marketing numbers in context, showing where you lead, where you trail, and which gaps are worth closing first.

Your latest campaign earned a 4% conversion rate. Is this considered good news?
Without any context, that number doesn’t really say much. It can be twice the industry average. It could be trailing every serious competitor. Or it’s a perfectly respectable percentage for one channel and underwhelming for another.
Key takeaways
- Competitive benchmarking compares your marketing performance, strategy, or customer experience with relevant competitors.
- The most useful benchmarks connect directly to a business goal, not whatever happens to be easiest to measure.
- Public data shows what competitors are doing, while customer research helps explain why it matters.
- Consistent definitions and measurement periods are essential for fair comparisons.
- A benchmark should lead to a decision, experiment, or action. Otherwise, it’s just an interesting number.
That’s where competitive benchmarking comes in: it helps you understand how your marketing compares with the rest of the field. When it’s done well, it can show where you’re winning, where you’re falling behind, and where the market is leaving an opportunity wide open.
But this isn’t an invitation to obsess over every campaign your competitors launch. No one needs another spreadsheet collecting digital dust. The goal is to gather just enough reliable information to make better decisions about your own marketing.
Let’s look at how.
What is competitive benchmarking?
Competitive benchmarking is the process of comparing your company’s performance, practices, or customer experience with those of direct or indirect competitors.
What does this mean? For a marketing team, it could be comparing:
- Website traffic and search visibility
- Social engagement
- Email frequency and messaging
- Paid advertising activity
- Content output
- Brand awareness
- Customer sentiment
- Conversion rates
- Share of voice
- Customer experience
Competitive benchmarking is closely related to competitive analysis, but the two aren’t quite the same. Competitive analysis creates a broad picture of another company: its audience, positioning, products, strengths, and weaknesses. Benchmarking focuses on defined points of comparison. It asks, “How do we perform against a relevant standard?”
Think of it as studying the playing field. Benchmarking is checking the scoreboard.
Why competitive benchmarking matters
Marketing data rarely includes built-in context.
You may know that website traffic increased 12% or that your latest email had a 31% open rate. Those figures tell you what changed internally, but not whether you’re gaining or losing ground in the market.
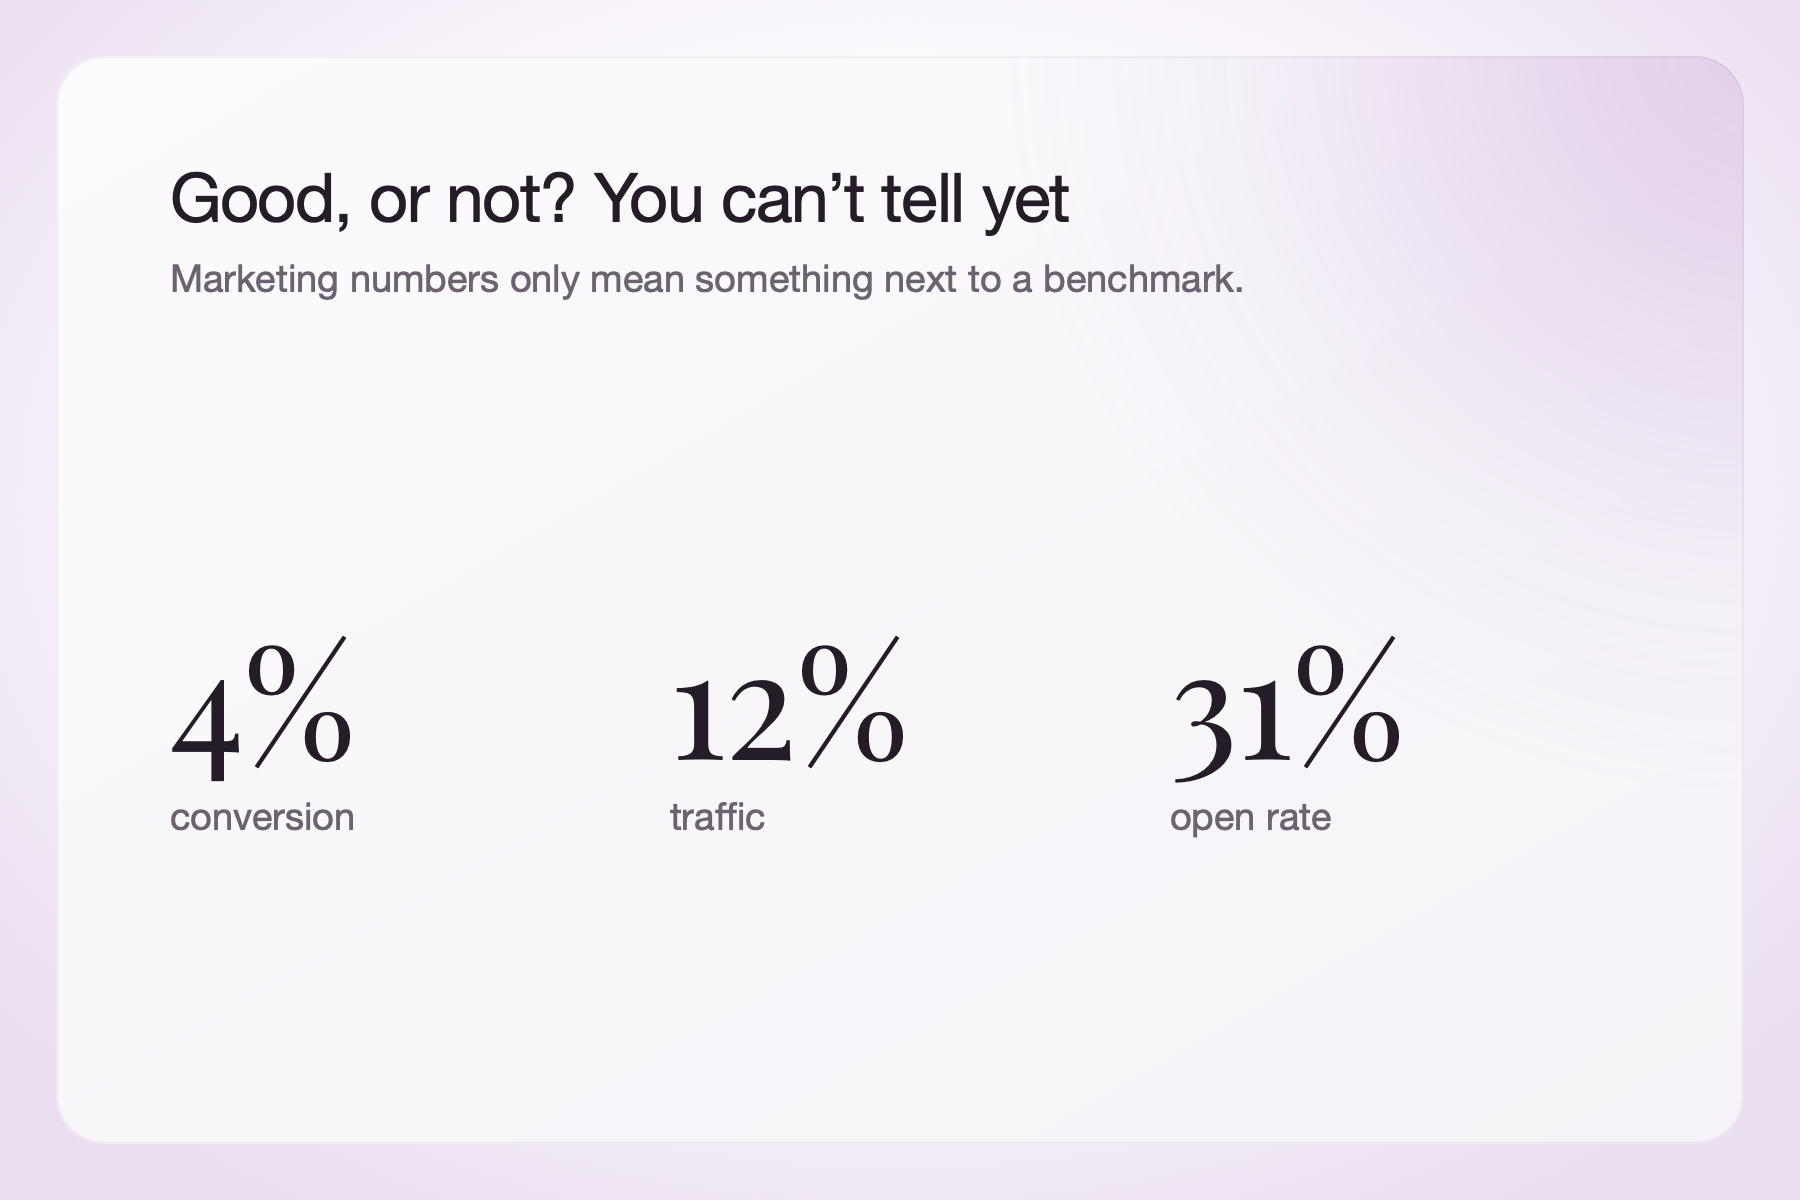
Competitive benchmarking gives your metrics something meaningful to sit beside.
It can help you: set more realistic performance targets, find gaps in a crowded market, make a stronger case for budget or resources, and spot emerging customer expectations.
It’s also a useful cure for “we’ve always done it this way.” If competitors are making it significantly easier to request a demo, discover pricing, or get an answer, your audience may start expecting the same from you.
That doesn’t mean you should copy them. It means the definition of a good customer experience has changed, and you need to decide how to respond.
Choose what you want to learn
Before gathering data, get clear on the decision you’re trying to make.
“Let’s benchmark our marketing” sounds productive, but it’s still too broad. A useful project starts with a focused question, like:
- Are competitors gaining organic visibility faster than we are?
- How does our brand awareness compare within a priority segment?
- Is our lead-generation experience creating unnecessary friction?
- Which topics are competitors overlooking?
- How do customers perceive our value compared with alternatives?
- Are we investing too much (or too little) in a particular channel?
This follows the same principle as any strong market research process: identify the problem before deciding on your methods.
Once you know the question, decide what success looks like. If the goal is to improve brand awareness, for example, you may track unaided awareness, branded search interest, social share of voice, and message recall. You may not need to compare every button on every competitor’s website.
Pick the right competitors
Your benchmark is only useful if the comparison makes sense. You’ll want to start with 3 competitor groups:
- Direct competitors sell a similar solution to a similar audience. They’re usually the most obvious comparison.
- Indirect competitors solve the same customer problem differently. A project management platform, as an example, may compete indirectly with spreadsheets, email, or an internal tool.
- Aspirational competitors are brands you want to learn from, even if they operate at a different scale or in another category. They may excel at onboarding, community building, content, or customer research.
Aim for a focused group of about 3 to 6 companies. Too few can give you a distorted picture; too many can turn your project into a full-time surveillance operation.
And be honest about scale. Comparing a 5-person startup’s share of voice with a global company’s isn’t especially enlightening. Compare organizations with similar audiences, business models, markets, or levels of maturity whenever possible.
Decide which metrics to benchmark
The right metrics depend on your question, but marketing benchmarks generally fit into 4 categories.
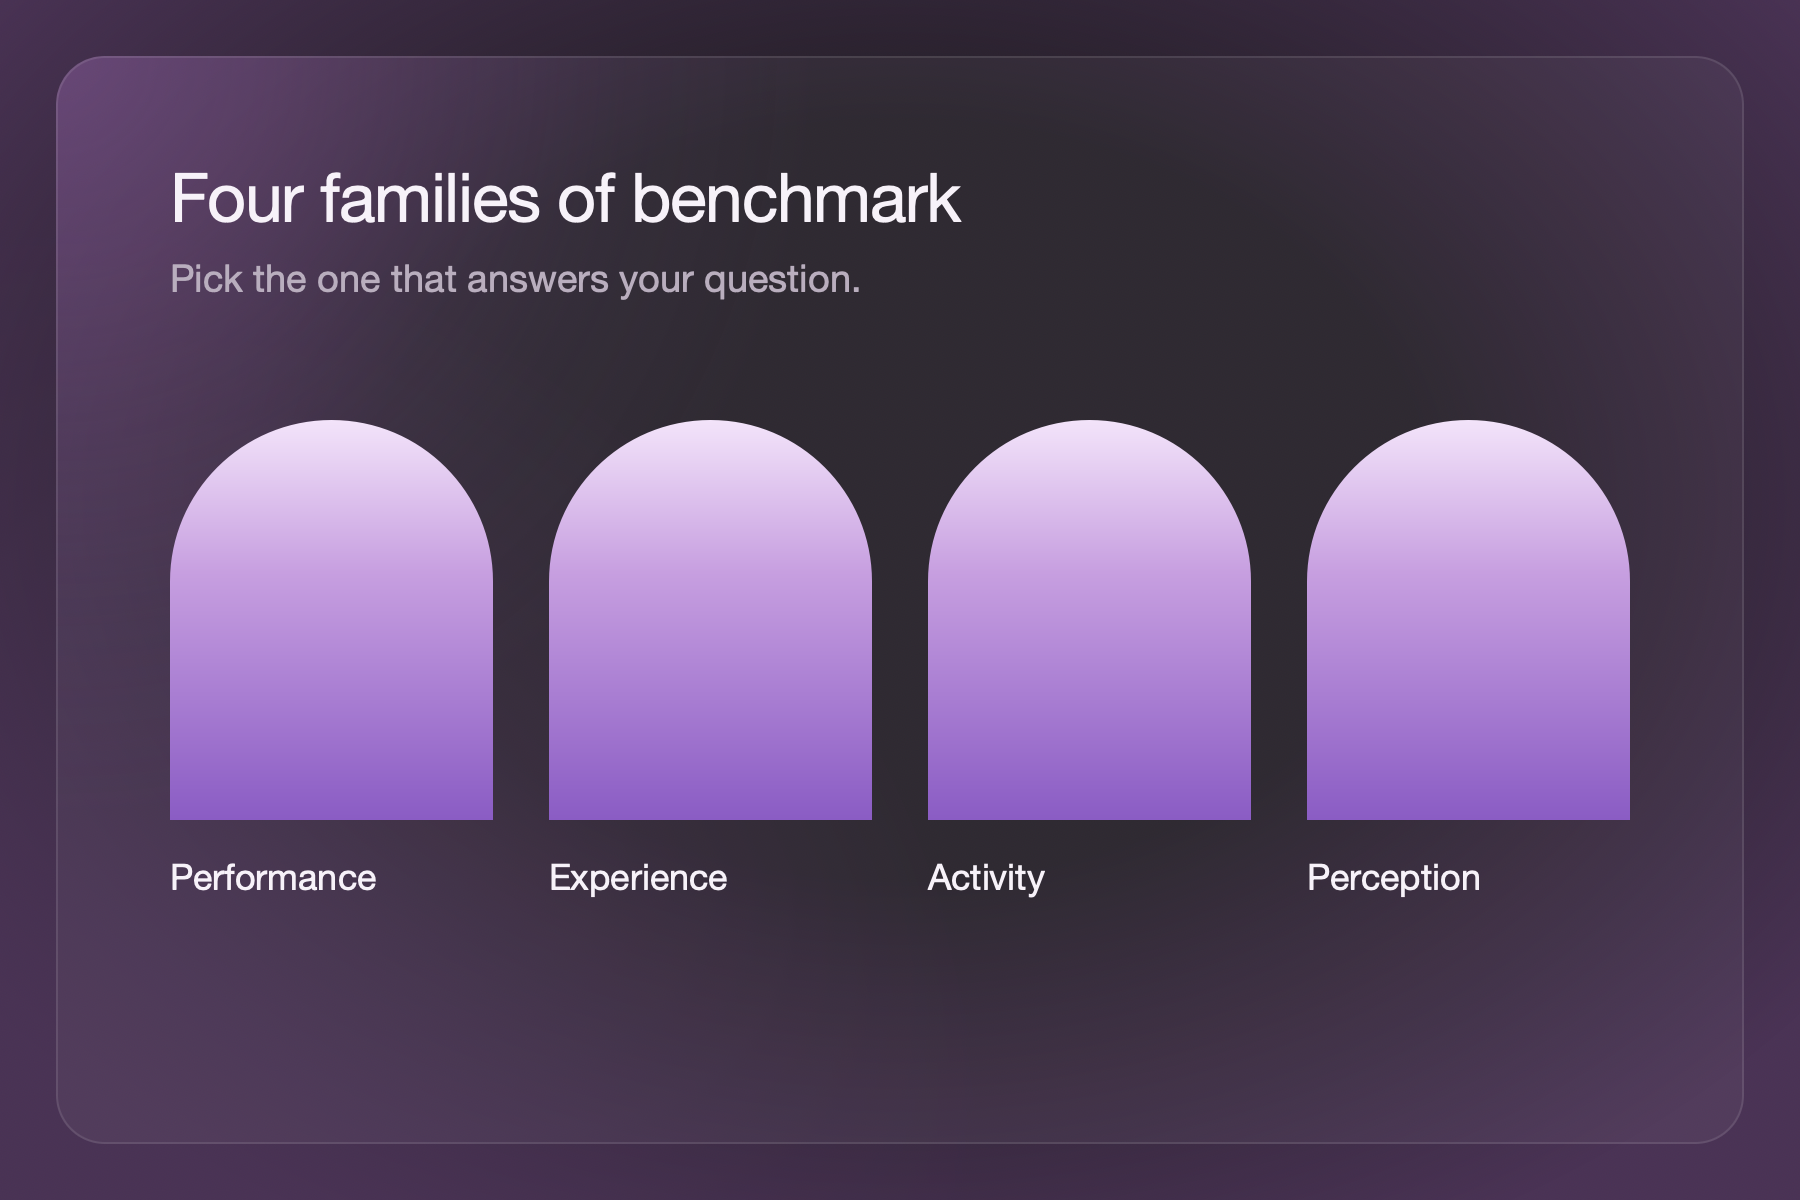
Performance benchmarks
These compare measurable results, including traffic growth, keyword ranking, engagement rates, conversions, customer acquisition cost, or email performance.
Only compare like with like. A conversion rate for an ebook download isn’t directly comparable with one for a sales demo. Definitions, channels, audiences, and time periods all matter.
Experience benchmarks
These compare what prospects and customers encounter. You may assess navigation, mobile usability, response time, form length, personalization, onboarding, or support options.
Tools like Google’s PageSpeed Insights can help with technical website comparisons. You can also walk through each competitor’s journey yourself, from the first visit to follow-up email, and document the experience.
Activity benchmarks
These look at what competitors are doing: publishing frequency, campaign cadence, channel mix, ad volume, event activity, or content formats.
Activity doesn’t equal effectiveness, though. A competitor publishing 5 times a week isn’t automatically outperforming your thoughtful monthly report.
Perception benchmarks
These explore what people think and feel about different brands. Metrics could include awareness, preference, trust, value for money, ease of use, or likelihood to recommend.
This is where direct audience research becomes especially valuable. Behavioral data can tell you that someone chose another brand. A well-designed survey can tell you why.
Gather data without getting creepy
A surprising amount of benchmarking data is available publicly. You can review competitor websites, newsletters, social channels, reports, customer reviews, job listings, and search results.
Google Trends can help you compare search interest over time. The Meta Ad Library lets you review active ads across Meta products. SEO and social listening platforms can add estimated traffic, keyword, backlink, and share-of-voice data.
Just remember that third-party figures are often estimates. Treat them as directional signals, not audited financial statements. Public information has a blind spot: it shows what a competitor says and does, but not necessarily what customers notice or value.
To fill that gap, ask your audience.
A competitive perception survey can include questions like:
- Which brands come to mind when you think about this category?
- Which of these brands have you heard of?
- Which brand would you consider first?
- What matters most when choosing a solution?
- Which brand do you associate with being easiest to use?
- What nearly stopped you from choosing us?
- Which alternatives did you consider?
- What made your final choice feel right?
Keep the language neutral. “Why is our product better?” might make your marketing team smile, but it won’t produce trustworthy data.
Pew Research Center’s guide to writing survey questions explains how wording, answer choices, and question order can influence responses. Our guide to survey questions people actually answer also provides practical tips for keeping questions clear, focused, and conversational.
If you need a head start, customize one of our market research survey templates. Use logic to show people only relevant questions, and include a mix of structured answers and open-text follow-ups.
A score tells you where you stand. A thoughtful comment tells you what to do next.
Build a simple scorecard
Now it’s time to organize what you’ve found.
Create a scorecard with one row per metric and one column for each competitor. Include your own brand, the source, the measurement period, and any important caveats.
For qualitative criteria, use a consistent scale. You may rate each experience from 1 to 5, but define every score first. For example:
- 1: Difficult to complete; major information is missing
- 3: Functional and clear; little personalization
- 5: Fast, intuitive, and tailored to the user
Clear definitions make the process less subjective, especially when several people are doing the research.
Capture a baseline and repeat the exercise each quarter or twice a year. Competitive benchmarking becomes more useful when you can see movement, not just a snapshot.
Turn comparisons into action
This is where some teams often slip up.
They collect data. They admire the charts. They say, “Interesting.” Then everyone returns to the same campaign calendar.
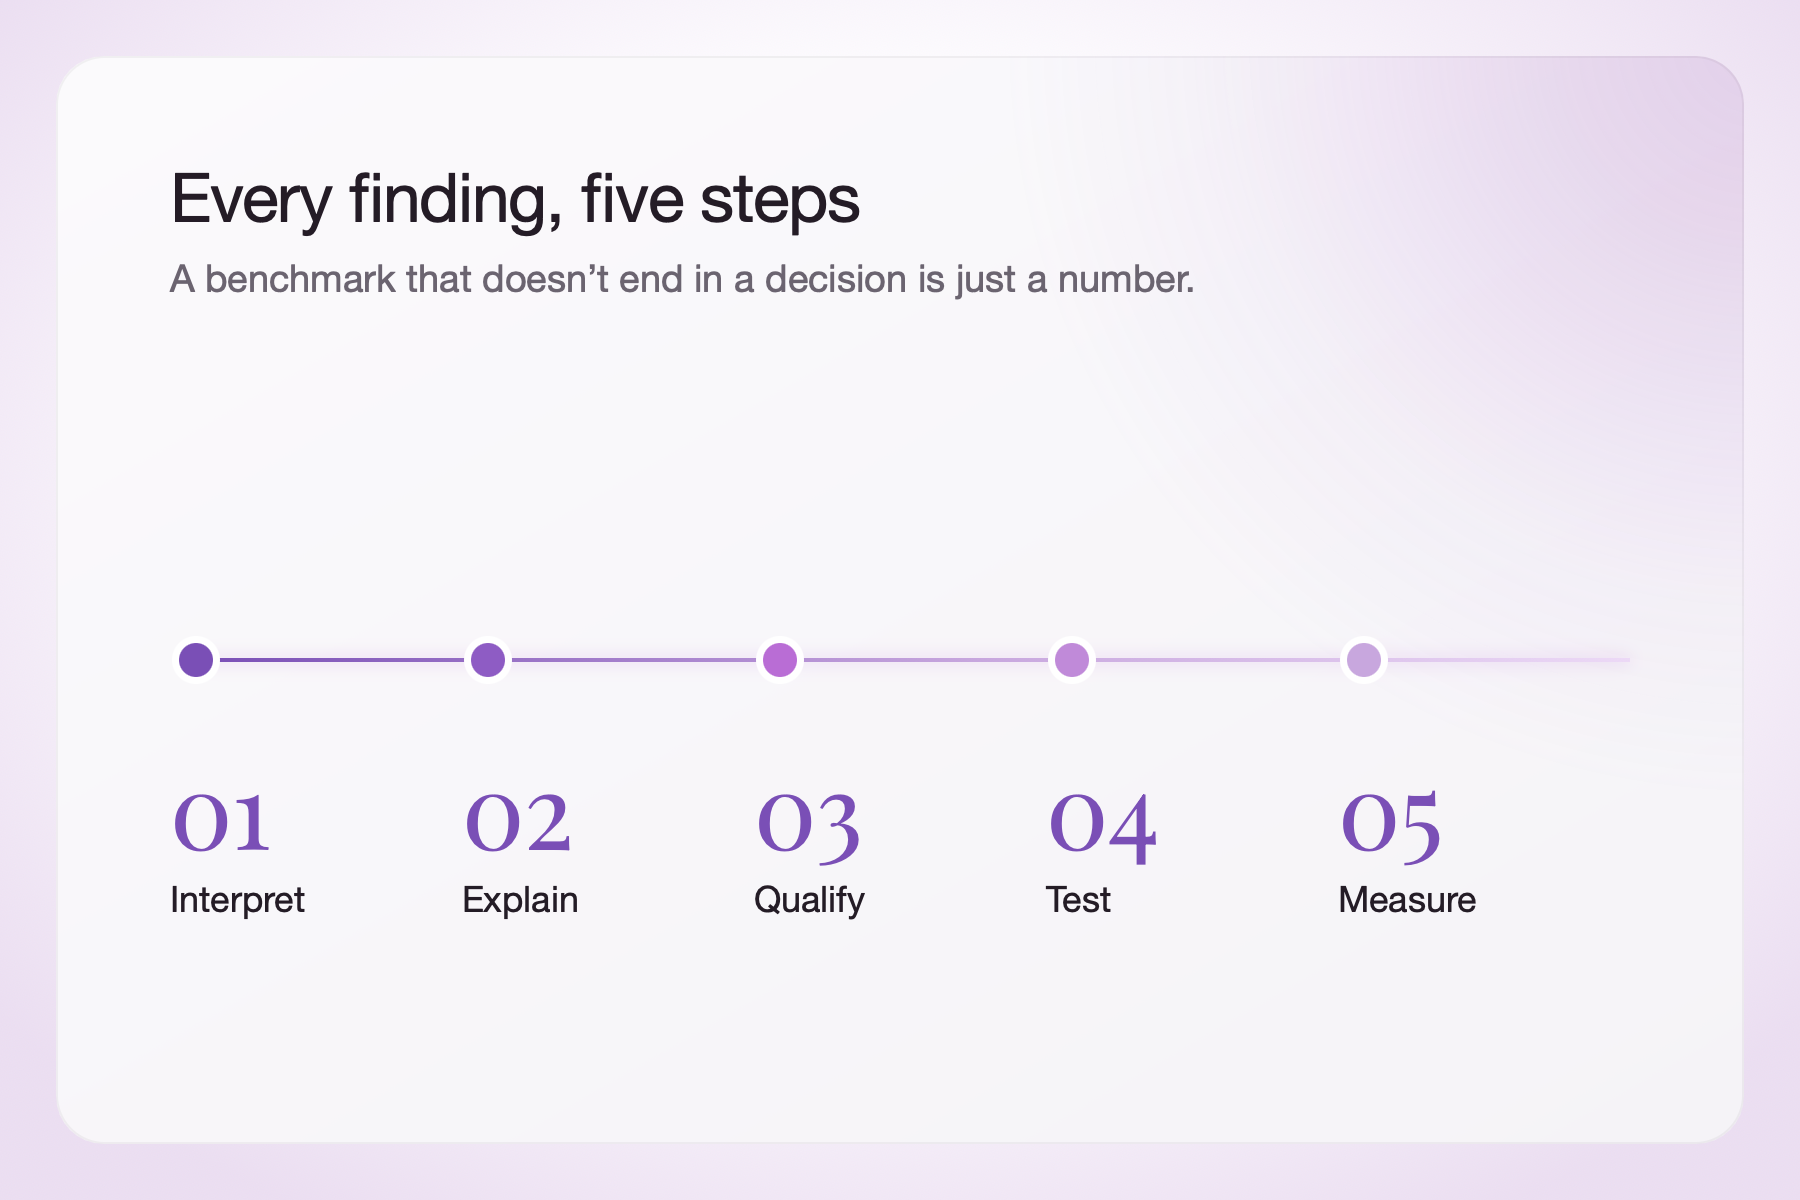
Suppose competitors receive more social engagement. Posting more often is one possible response, but not necessarily the right one. Look deeper and you may discover that their audience engages with original research while yours sees mostly promotional content.
Your action can be to survey customers about a timely issue, turn the findings into a report, and repurpose the insights across social posts, email, and sales materials.
That’s much more useful than “publish 3 extra posts.”
Our guide to surveying your target audience can help you reach the right people and turn their responses into sharper marketing decisions.
Avoid the benchmarking copycat trap
Competitive benchmarking should help you differentiate, not disappear into the crowd.
If every competitor runs webinars, that doesn’t automatically mean you need another one. Your audience may prefer a 5-minute interactive assessment. If everyone competes on feature count, you may stand out by making the buying process easier.
Watch for a few common mistakes:
- Comparing vanity metrics with no link to business outcomes
- Treating estimated data as exact
- Changing definitions between reporting periods
- Ignoring differences in audience, budget, or business model
- Assuming competitor activity is evidence of success
- Collecting data without assigning an owner or next step
Most importantly, keep talking to customers. Competitors can show you what already exists. Customers can show you what’s still missing.
Make your next move about your audience
Competitive benchmarking isn’t about winning every metric. It’s about choosing where your brand should compete and where it shouldn’t.
Use competitor data to add context, not to replace your own strategy. Pair observable market signals with direct customer feedback. Then turn the strongest insights into focused experiments your team can actually run.
Because the best outcome isn’t a beautiful benchmark report.
It’s a better decision.

Liked that? Check these out:


Opinions and Expertise
What’s actually slowing research teams down (Hint: it’s not the research)
From recruiting participants and scheduling interviews to building the actual surveys, the operational drag is taking researchers away from what they do best. See what's actually slowing them down and how Research Flow fixes it.
Read more