Survey question types: A guide with 12 examples
The 12 types of questions every survey designer needs: from Likert scales and ranking questions to conditional branching, with examples and when to use each.
Choosing the right question format can make or break your survey. The wrong structure frustrates respondents, tanks completion rates, and leaves you with data that doesn’t answer what you need to know. The right one gets you honest, usable answers fast.
Each question type serves a different purpose; some gather quick yes-or-no feedback, others dig into nuance and preference. Understanding strengths and limits helps you design surveys people actually want to complete.
Let’s walk through the most common types, when to use them, and what kind of data they produce.
Dichotomous questions (yes/no)
A dichotomous question offers exactly two answer options: yes/no, agree/disagree, true/false, or satisfied/unsatisfied (SurveySparrow Dichotomous Questions, 2024). They’re fast, reduce respondent fatigue and dropout, and produce categorical data that’s easy to quantify without complex software. Pair them with open-ended or rating-scale follow-ups for richer detail (Zonka Feedback Why to Avoid Dichotomous Questions, 2024).
Example: “Have you used this product before? Yes / No”
Multiple choice questions
Multiple choice questions present three or more answer options with respondents selecting one. They work well when you’ve already defined the relevant answers. The downside? A missing option leaves respondents boxed in.
Example: “Which of the following best describes your role? Marketing / Sales / Customer Success / Product / Other”
Checkbox questions
Checkbox questions let respondents select multiple answers—useful when one person fits several categories. They capture the full picture but take longer to complete and produce more complex data. Avoid stacking too many options.
Example: “Which features do you use regularly? Analytics / Reporting / Automations / Integrations / Templates”
Likert scale questions
Likert scales ask people to rate agreement from “strongly disagree” to “strongly agree,” or “very unsatisfied” to “very satisfied.” They capture nuance without long answers and produce ordinal data that’s easy to analyze.
Example: “This product is easy to use. [Strongly Disagree] [Disagree] [Neutral] [Agree] [Strongly Agree]”
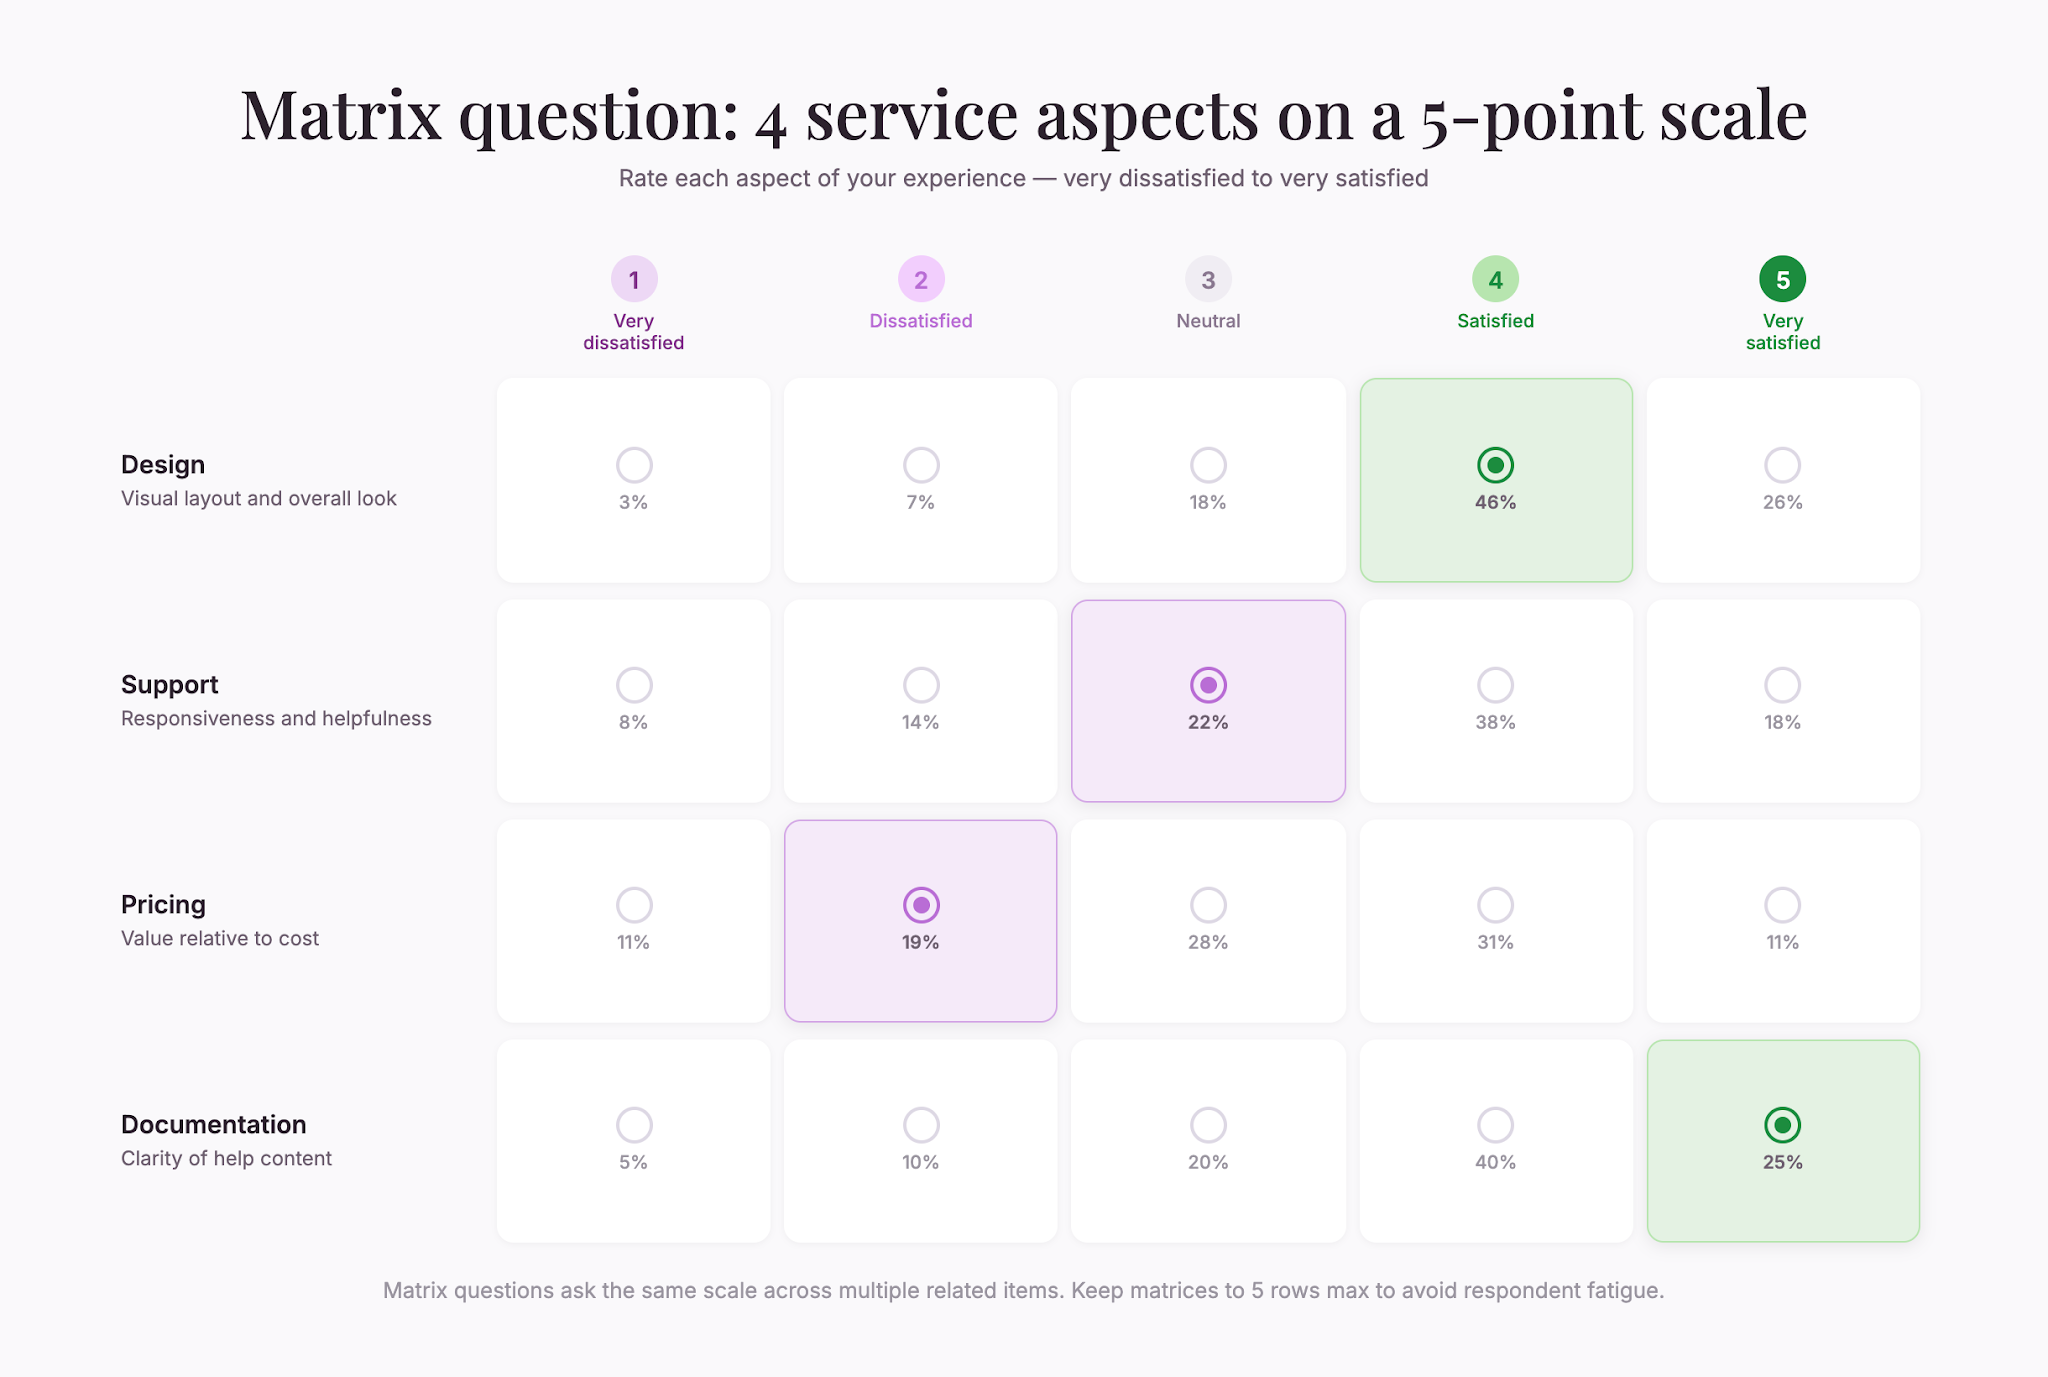
Matrix questions
Matrix questions ask the same question about multiple items at once using the same scale. They save space and time when you need to rate several related things. Keep matrices small—5 rows max—to avoid fatigue.
Example: A table comparing satisfaction with design, support, pricing, and documentation, all on the same five-point scale.
Ranking questions
Ranking questions ask respondents to order items by preference or importance. They reveal priority but are cognitively demanding. Cap at five items and avoid them in long surveys.
Example: “Rank these factors when choosing a vendor: Price / Customer support / Feature set / Security / Ease of use”
Open-ended questions
Open-ended questions invite freeform answers with no predefined options. They produce rich qualitative data and surface unexpected perspectives. The cost: answers take longer to write and analyze. Notably, 34% of online research panel respondents reported using LLMs to help answer open-ended survey questions (Zhang, Xu, Alvero, Sociological Methods & Research, 2025).
Use them strategically as follow-ups to quantitative items. Don’t stack multiple open-ended questions together—fatigue and answer quality both suffer.
Example: “What’s the biggest challenge you face in your workflow?”
Rating scale questions
Rating scales evaluate something on a numeric spectrum, usually 1–5 or 1–10. Unlike Likert scales, rating scales measure intensity, importance, or satisfaction. Always include anchors so respondents know what each number means.
Example: “On a scale of 1–10, how likely are you to recommend this product to a colleague?”
Demographic questions
Demographic questions ask who someone is: age, location, job title, company size, industry. They’re for segmenting results and checking whether patterns hold across groups. Place them at the end—they can feel sensitive.
Example: “What is your job title?” or “How many employees does your company have?”
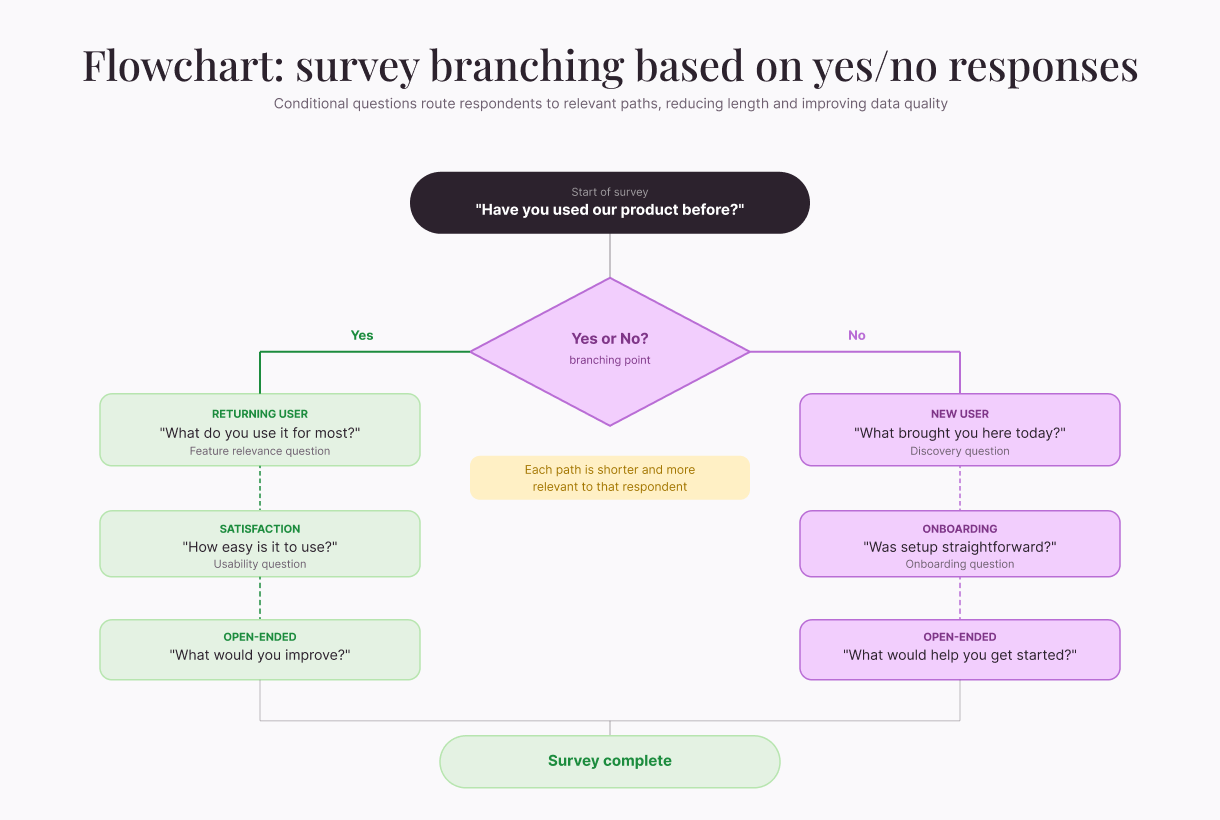
Conditional questions (branching)
Conditional questions appear only when a respondent answered a previous question in a certain way. They reduce length because people only see what’s relevant, cutting dropout and improving data quality. However, they do require the right platform.
Example: Someone answering “No” to “Have you used our product before?” goes down a different path than someone who said “Yes.”
Slider questions
Slider questions let respondents drag a control along a scale instead of clicking radio buttons. They feel engaging and support granular responses, but they can frustrate mobile users when the target is small.
Example: A horizontal slider asking “How satisfied are you?” from “Very Unsatisfied” to “Very Satisfied.”
Dropdown/select questions
Dropdowns show a list that opens when clicked. They save screen space and handle 8+ options well. On mobile, dropdowns can be clunky, so make sure to test before deploying.
Example: “Which country are you in?” with a dropdown of all countries.
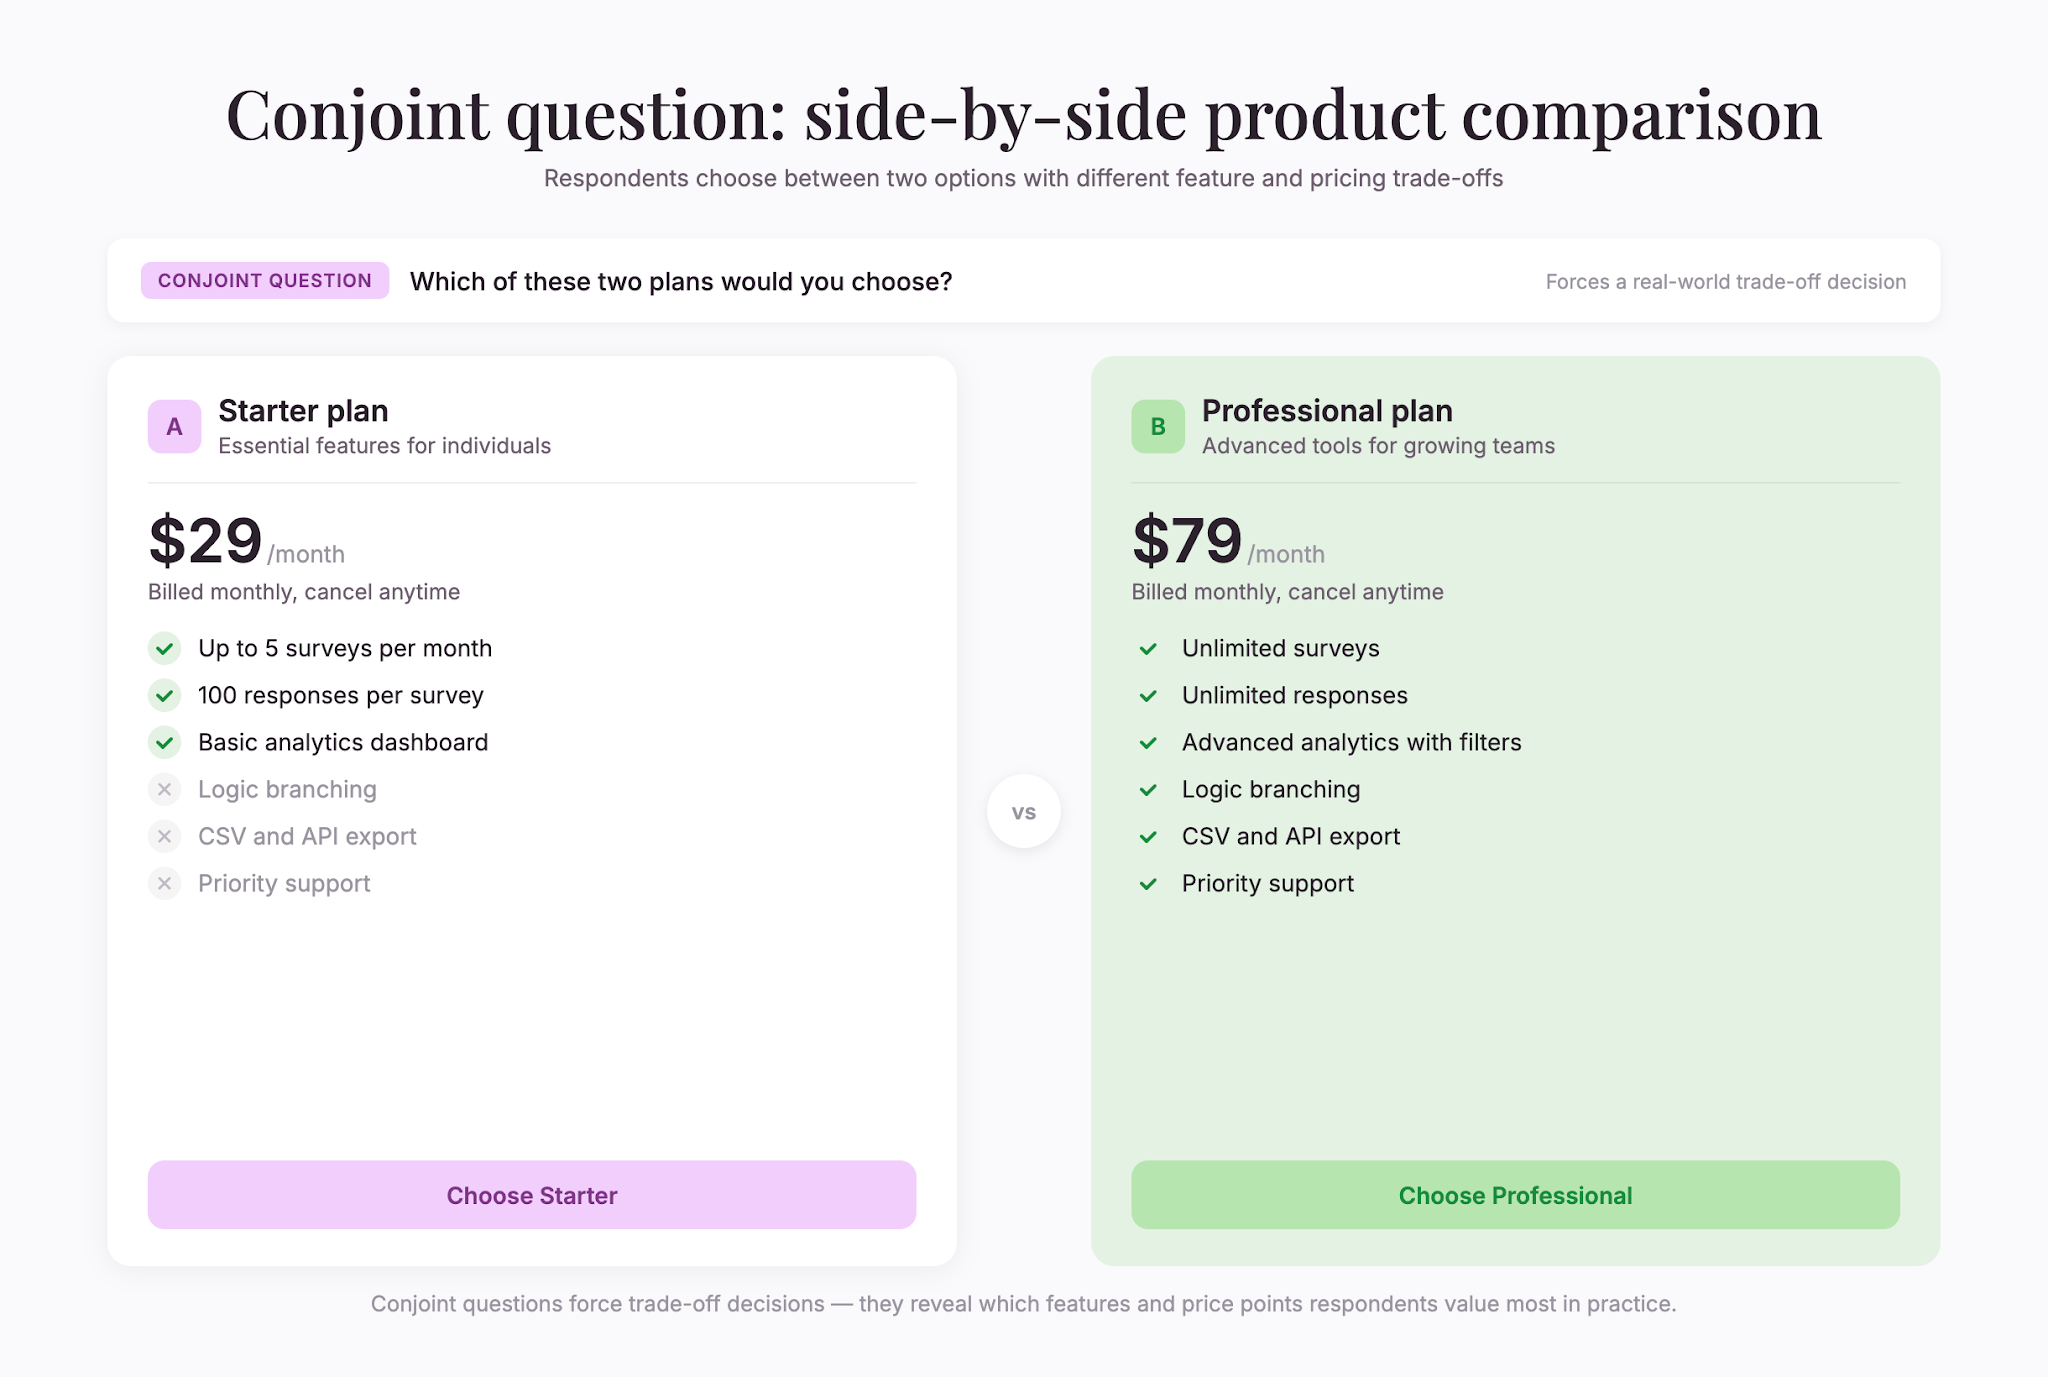
Conjoint or preference questions
Conjoint questions present two or more options side by side and ask which is preferred. They mimic real-world choices and reveal how people rank options when forced to compare directly. Use them sparingly—they’re cognitively demanding.
Example: Two product packages with different features and prices shown side-by-side. “Which would you choose?”
Design principles for any question type
Keep it short. Surveys with 1–3 questions are completed by 83.34% of respondents (SurveySparrow Survey Response Rate Benchmarks, 2025). Overly lengthy surveys can kill completion rates and reduce answer quality.
Watch for bias. Acquiescence bias (agreeing regardless of content) and social desirability bias (overreporting good behavior) skew results (Qualtrics, 2025). Be aware of how wording nudges responses.
Understand framing. The framing effect causes people to avoid risk when options are positively framed but seek risk when negatively framed (Frontiers in Psychology, 2020). “50% succeed” feels different from “50% fail.”
Test your survey. Preview on desktop and mobile. Read aloud. Ask colleagues what each question means. Ambiguity leads to poor data.
Mix and match. Most good surveys combine types. Yes/no for facts, open-ended for the why, rating scales for opinion. Together, they tell a complete story.
The right question type isn’t about sophistication—it’s about matching format to what you need to learn. Start with clarity about your goal, then choose the format that gets you there with the least amount of friction.
Liked that? Check these out:
.webp)
.webp)
Opinions and Expertise
The rise of adaptive, momentum-driven journeys (and the fall of the static funnel)
Human behavior isn't a neat funnel—it's a constellation of scattered but connected moments. Adaptive, momentum-driven journeys act on these moments in real time to deliver a customer experience that naturally drives conversions. That's why they're replacing the familiar but dead static funnel.
Read more

Opinions and Expertise
Customer flows, not funnels: Why marketers are rethinking how customers move
Marketing funnels assume customers move in straight lines—but they don't. Customer flows use automated workflows to build momentum, with one action triggering the next. See how Typeform Contacts & Automations helps you meet customers where they are, automatically.
Read more