What is a Likert scale? A guide with examples and templates
Likert scales measure attitudes on a 5- or 7-point spectrum. Get design rules, mistakes to avoid, interpretation tips, and free survey templates here.
When you want to measure someone’s opinion or attitude without forcing them into a yes-or-no box, a Likert scale is one of the most reliable tools available. It lets people express degrees of agreement or satisfaction along a spectrum. Instead of “Do you like this?” you can ask “How much do you agree that this is valuable?” and let them choose somewhere between “Strongly Disagree” and “Strongly Agree.”
Likert scales are everywhere—in customer satisfaction surveys, employee feedback, academic research, and user testing. They’ve been around since the 1930s and remain popular because they work. They capture nuance, produce data that’s easy to analyze, and feel natural to answer.
The basics of a Likert scale
A Likert scale is an ordinal scale that measures attitudes or opinions by asking people to rate their level of agreement with a statement. The scale typically has an odd number of options—usually 5 or 7—arranged symmetrically around a neutral middle point.
The classic 5-point Likert scale looks like this:
- Strongly Disagree
- Disagree
- Neutral
- Agree
- Strongly Agree
Other common versions use:
- Very Unsatisfied, Unsatisfied, Neutral, Satisfied, Very Satisfied
- Strongly Oppose, Oppose, Neutral, Support, Strongly Support
- Never, Rarely, Sometimes, Often, Always
Respondents choose a position on a spectrum rather than selecting one category or writing an open answer.
Why use Likert scales?
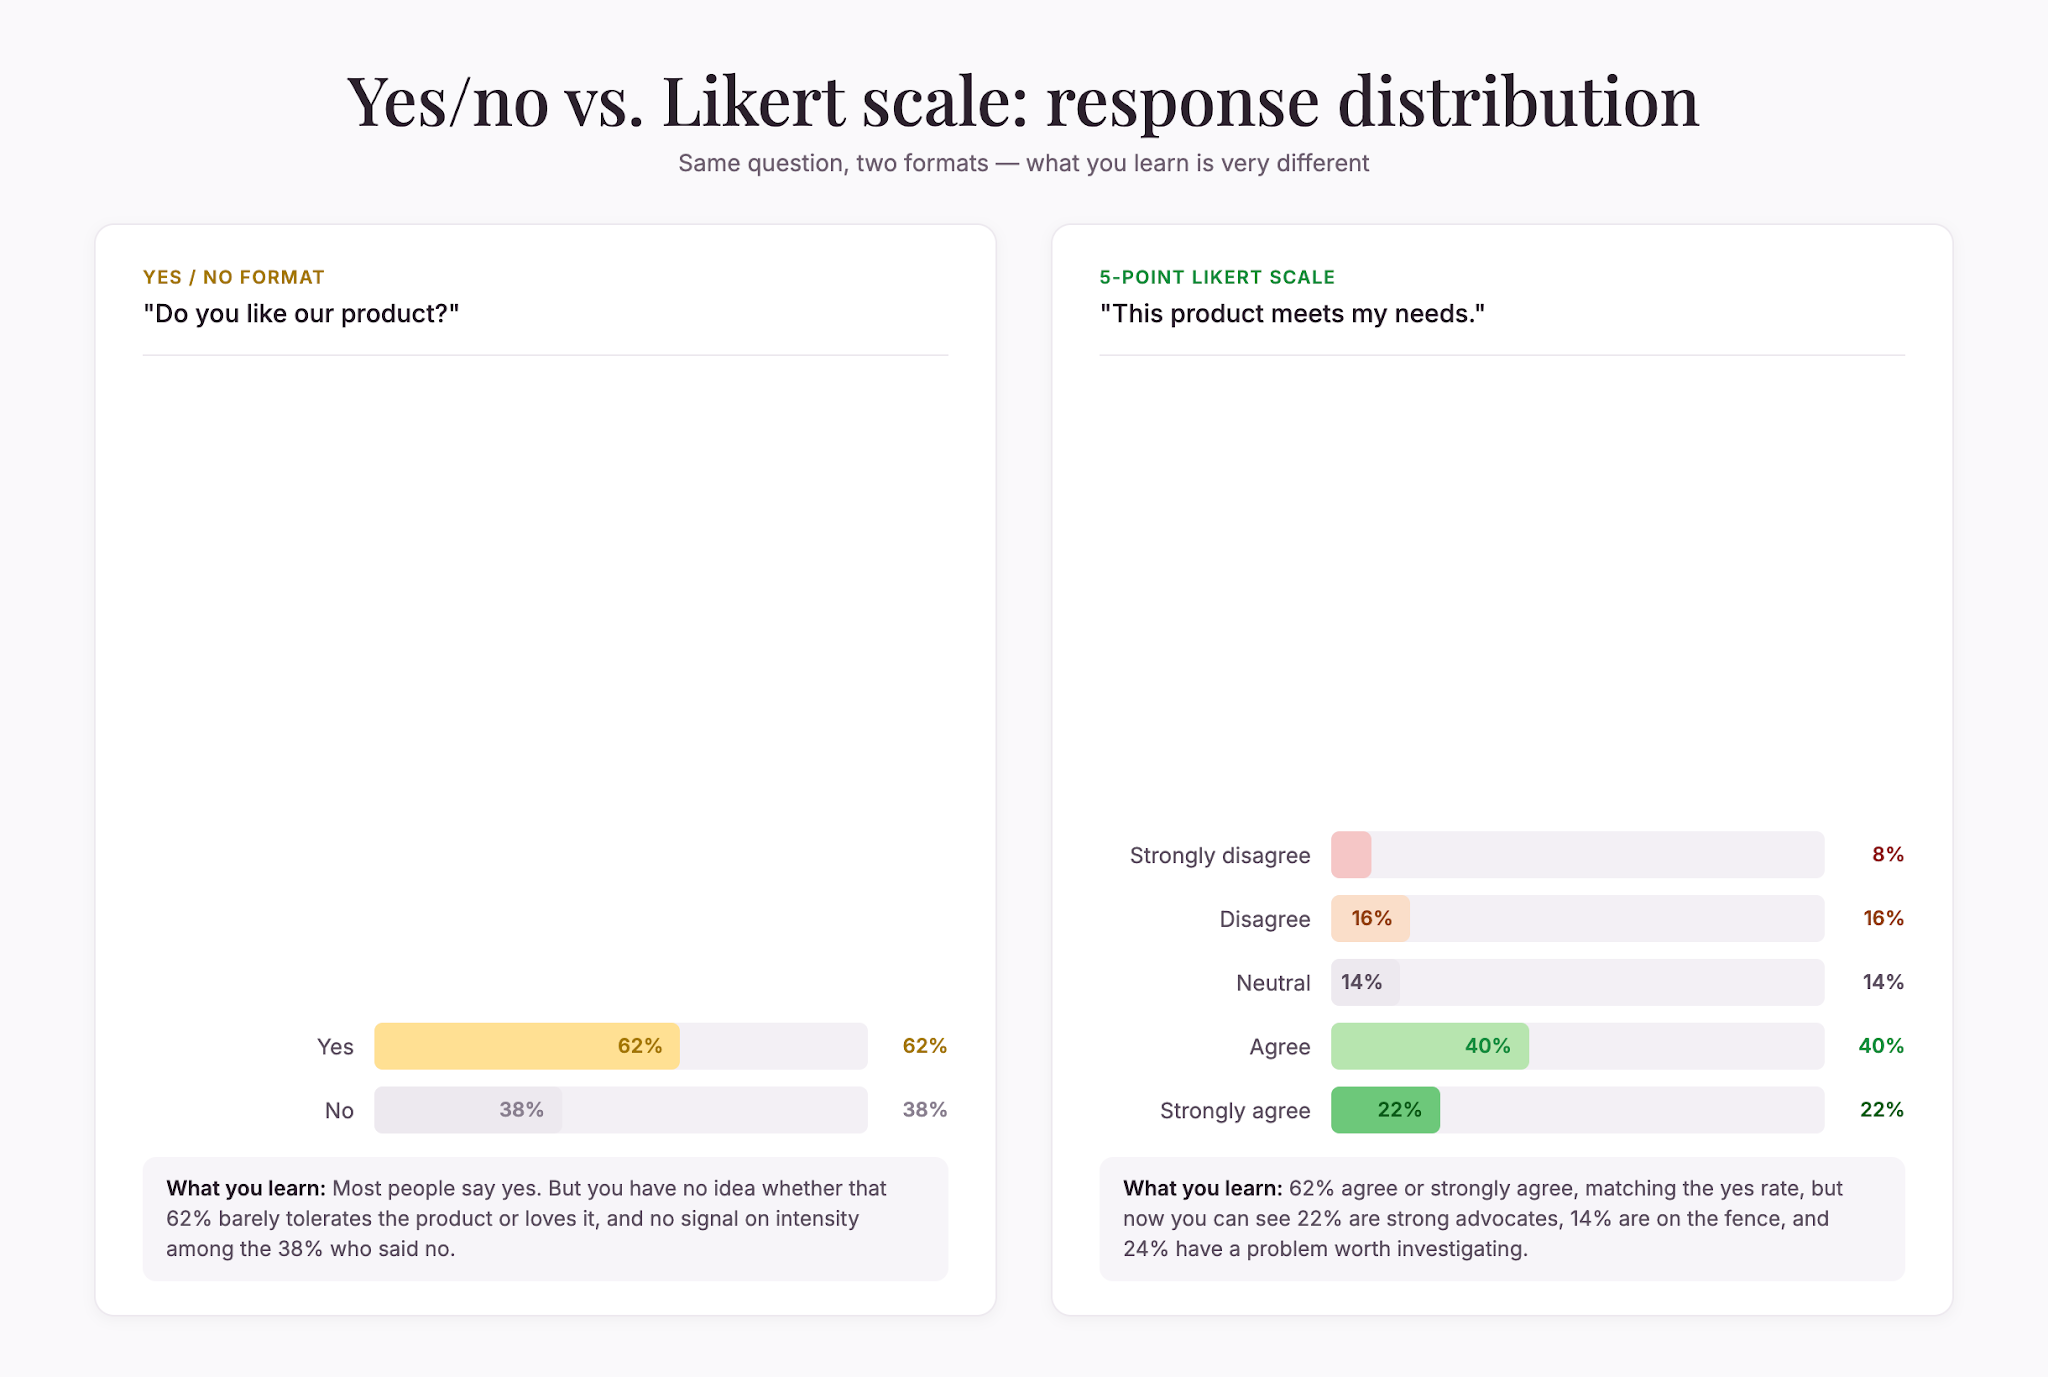
Likert scales balance simplicity with depth. They’re faster to answer than open-ended questions and easier to quantify than text responses. They also capture more nuance than binary yes-no questions.
When you ask “Do you like our product?” with a yes-or-no format, you learn whether they like it, but nothing about how much. A Likert scale reveals whether they barely tolerate it or love it. That distinction matters.
They also feel intuitive to most respondents. People are accustomed to rating things on scales, with little confusion about what you’re asking or how to answer.
How to create an effective Likert scale
Write a clear statement, not a question. Likert scales work best with declarative statements. Instead of “How much do you agree that our customer service is helpful?” write “Our customer service is helpful” and let people respond with their level of agreement.
Use symmetrical scales. A proper Likert scale has an equal number of positive and negative options, with a neutral middle. If you use 5 points, have 2 negative, 1 neutral, and 2 positive options. This prevents bias toward one end.
Choose odd-numbered scales. Five-point scales are standard. Seven-point scales work too, though they require more nuance from respondents. Avoid even-numbered scales because they force people to pick a side and remove the neutral option.
Use consistent anchor labels. If you’re asking multiple Likert questions in a row, use the same scale for each. Switching between “Strongly Disagree/Strongly Agree” and “Very Dissatisfied/Very Satisfied” confuses respondents.
Make labels clear and parallel. Use balanced, natural language. “Strongly Agree” pairs well with “Strongly Disagree.” “Never” pairs with “Always.”
Keep the scale visible. Show the full scale with every question, especially in longer surveys.
Common mistakes to avoid
Don’t use leading language. “Wouldn’t you agree that our product is amazing?” biases people toward agreement. Stick to neutral statements: “This product meets my needs.”
Don’t mix scales in one survey. Switching from 5-point to 7-point scales confuses respondents and complicates comparison.
Don’t make the neutral option feel like a cop-out. The middle option serves a purpose for respondents with genuinely neutral opinions. Label it “Neutral” rather than “No Opinion.”
Don’t rely solely on Likert scales. They work well alongside other question types. Use Likert questions to establish opinion, then open-ended follow-ups to explain why.
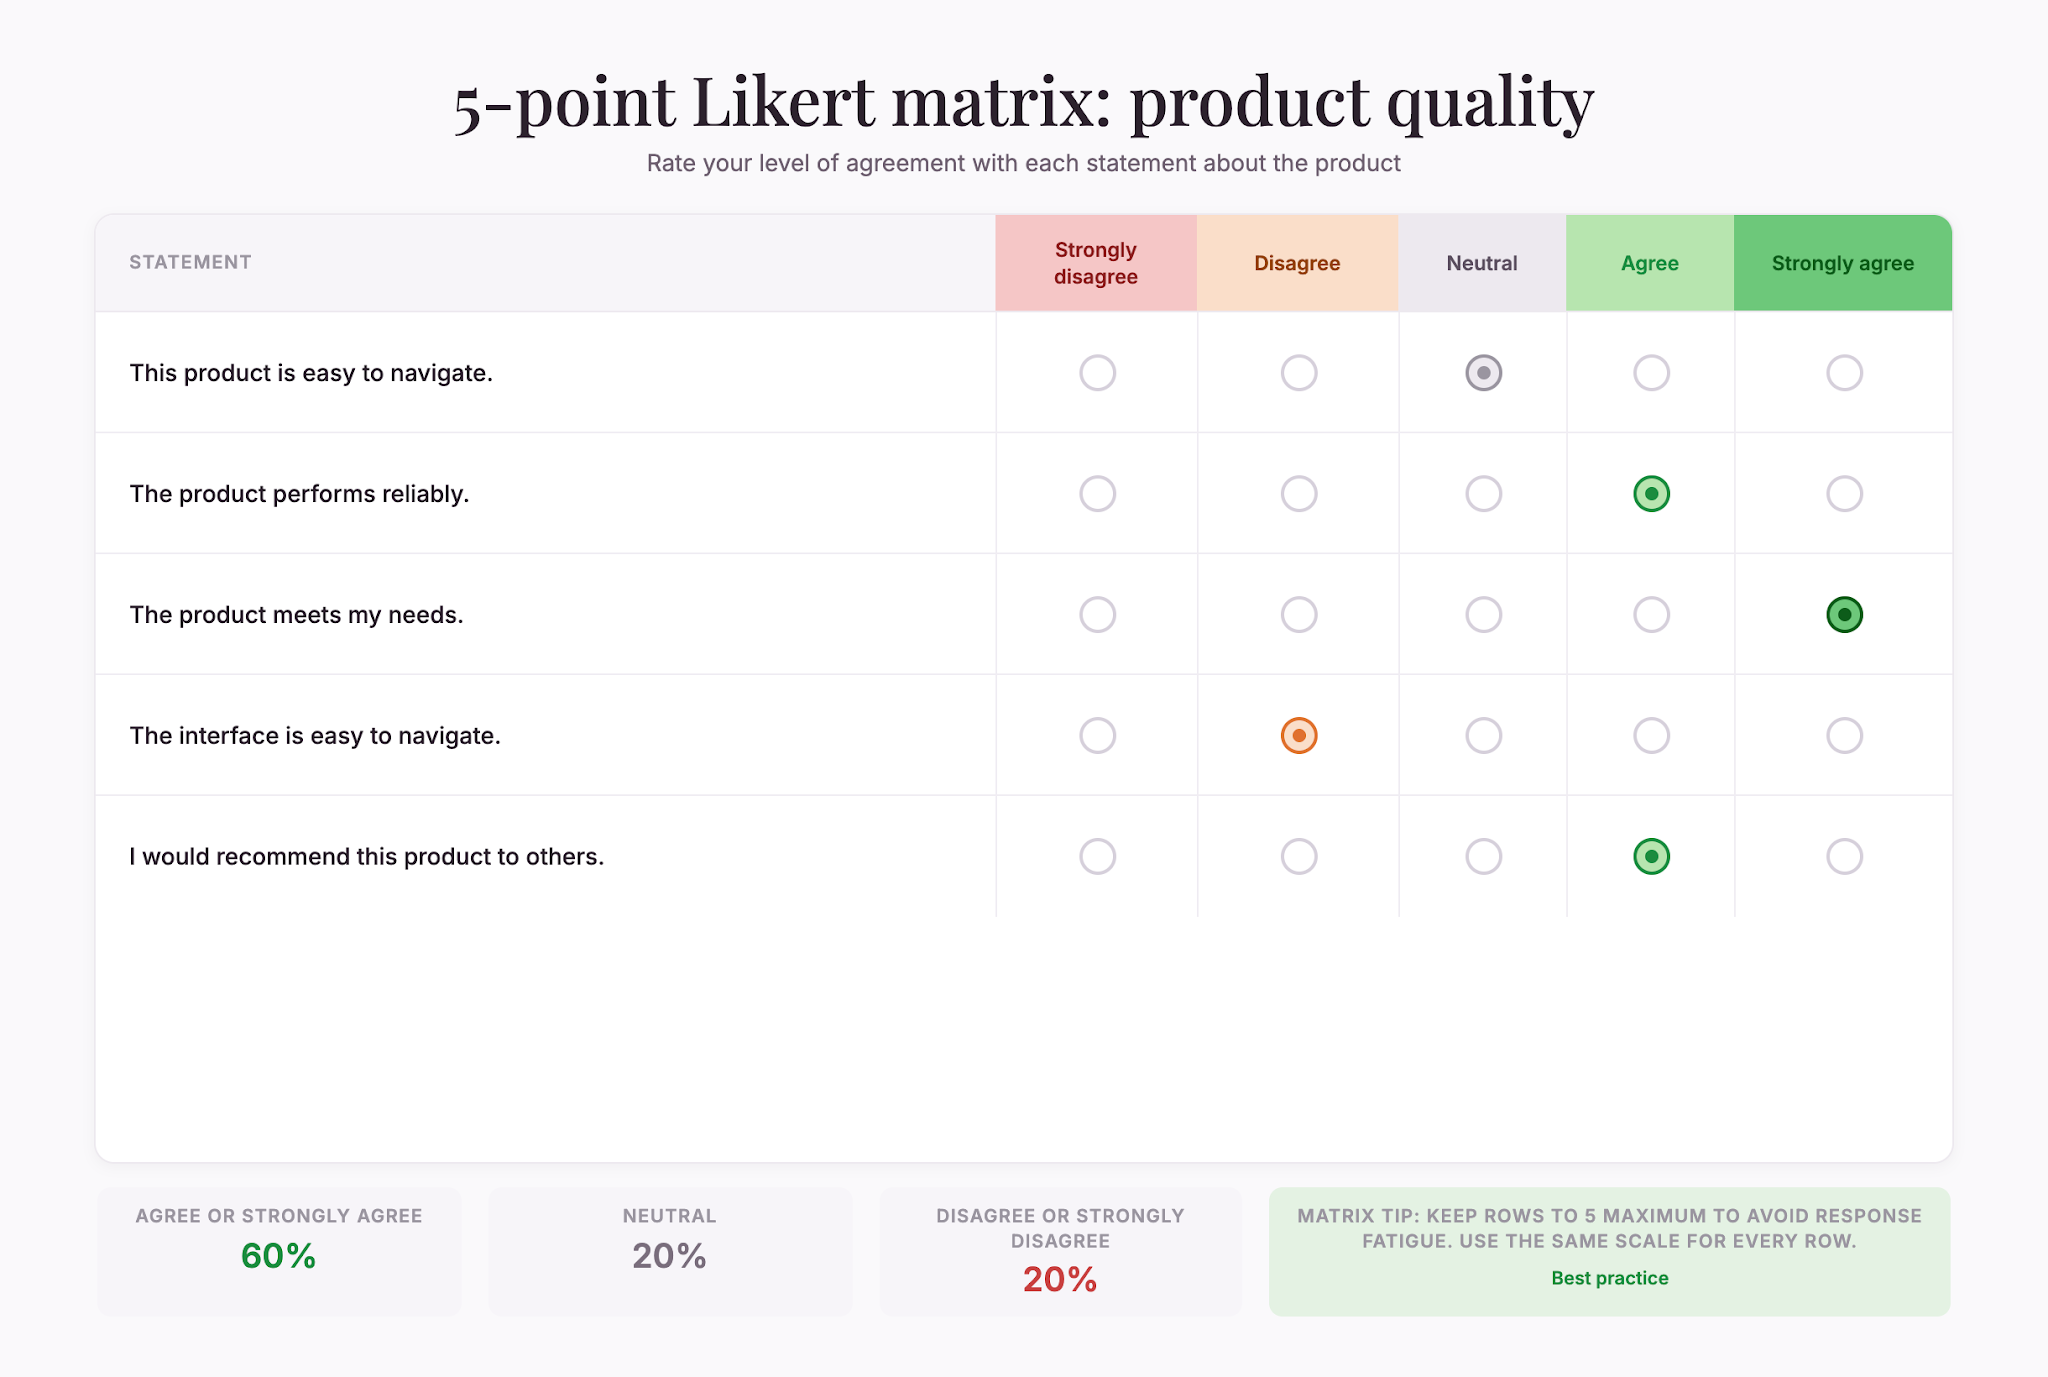
Don’t overload the survey. Matrix questions save space but can cause response fatigue. Keep matrices to 5 rows maximum.
Interpreting Likert scale data
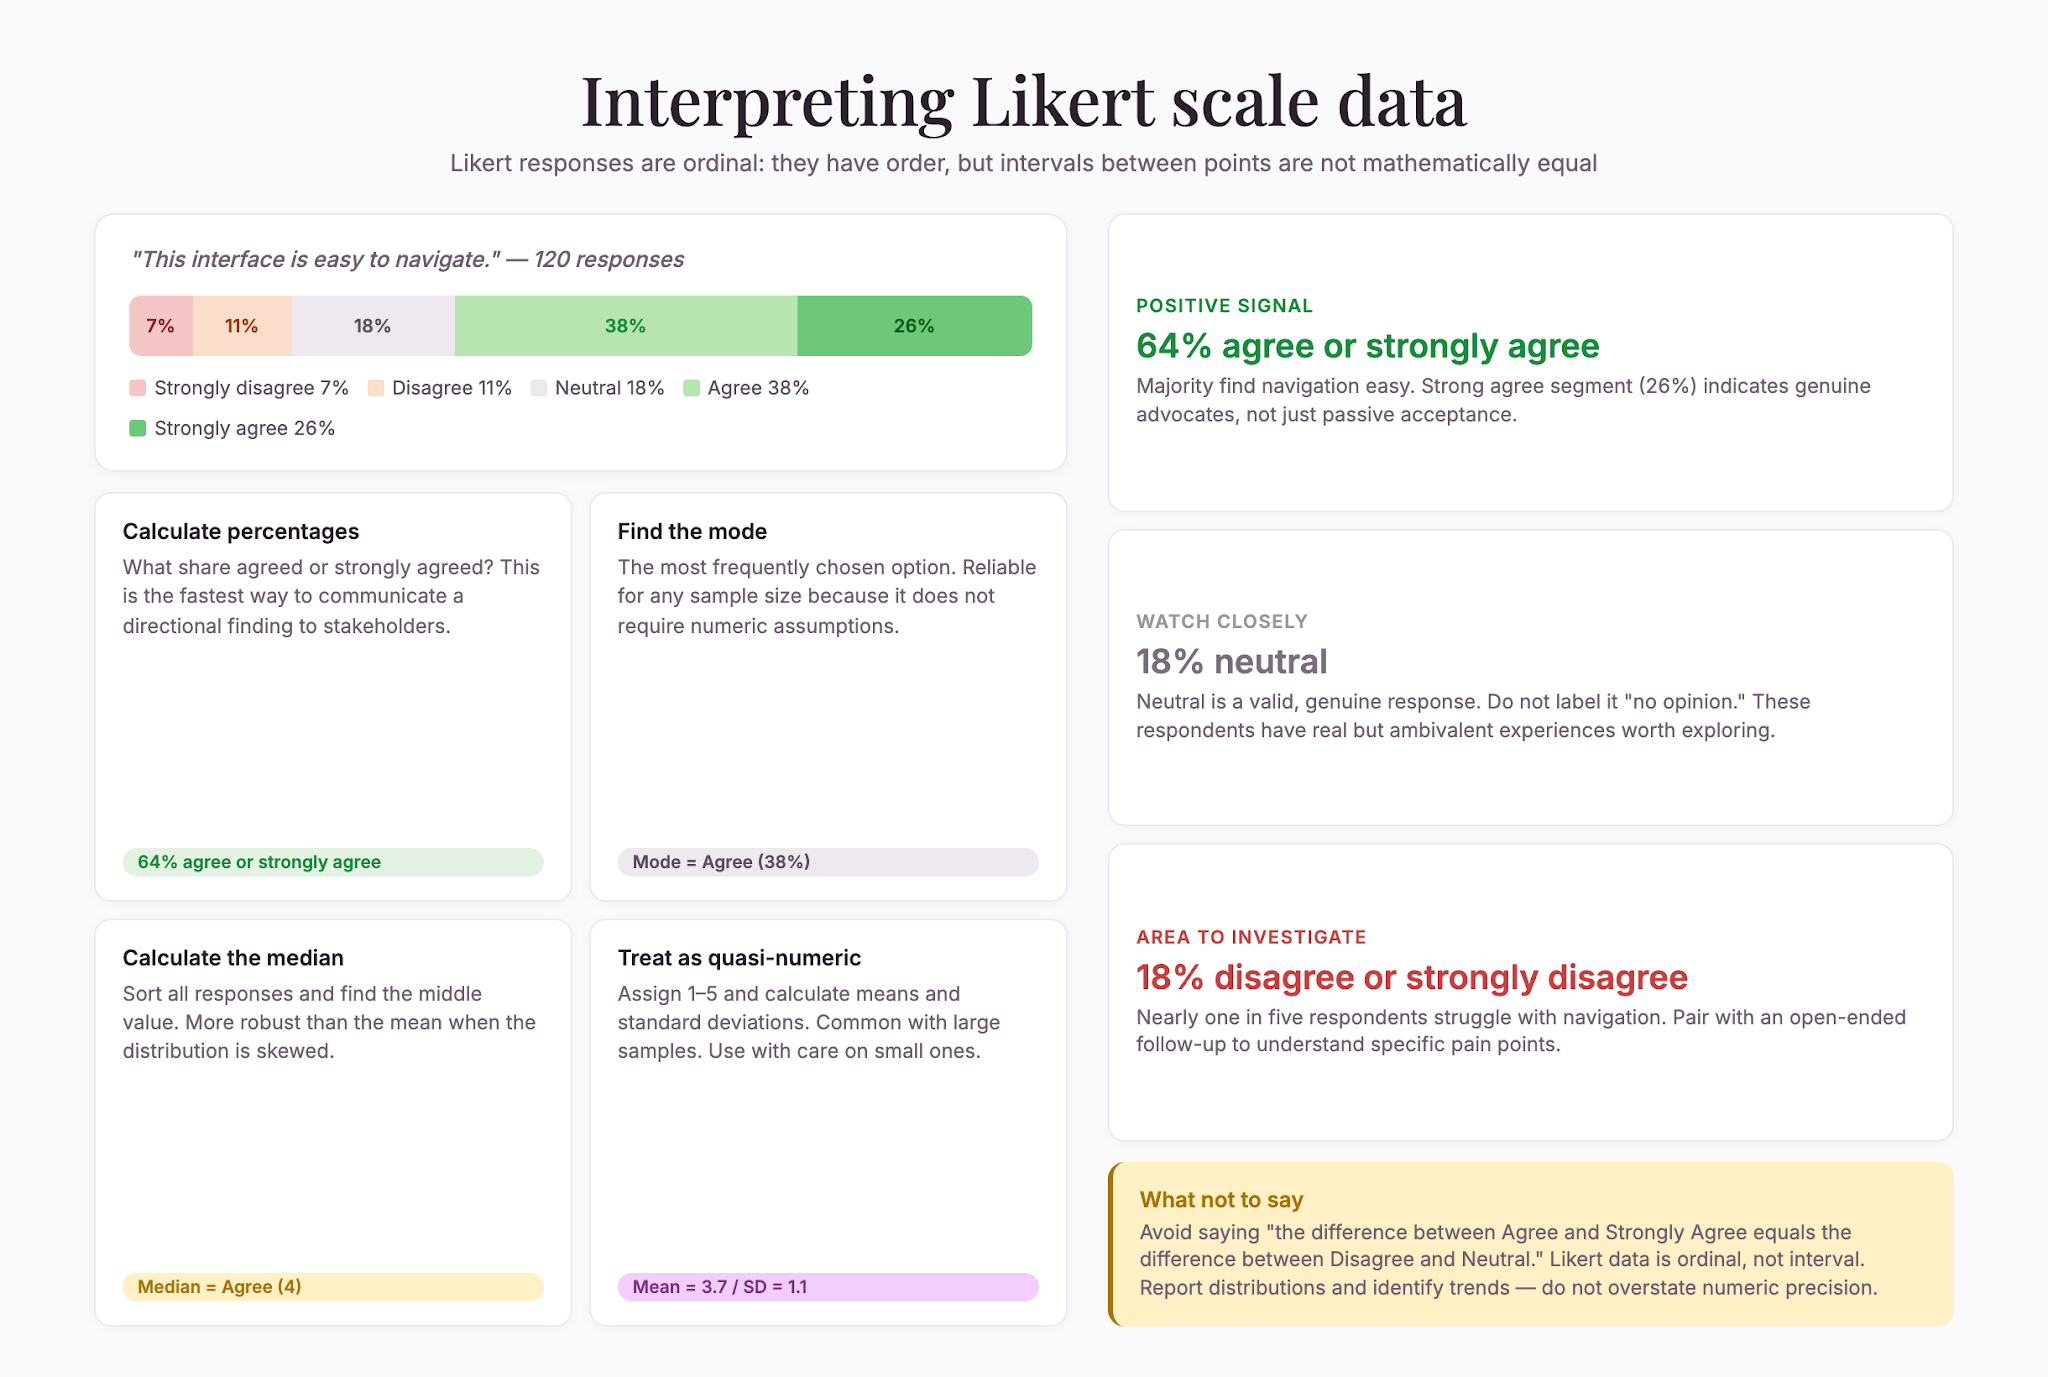
Once you’ve collected responses, Likert scales produce ordinal data, meaning responses have a natural order (Disagree < Neutral < Agree), but intervals between points aren’t mathematically equal.
You can:
- Calculate percentages. What percentage of people agreed or strongly agreed?
- Find the mode. Which response option was selected most often?
- Calculate the median. The middle value when all responses are sorted in order.
- Treat it as quasi-numeric. Many researchers assign numbers (1 = Strongly Disagree, 5 = Strongly Agree) and calculate means and standard deviations. This is common practice with large sample sizes.
Avoid treating Likert responses as precisely numerical. You can report distribution and identify trends, but you can’t say the difference between “Agree” and “Strongly Agree” equals the difference between “Disagree” and “Neutral.”
Likert scale templates and examples
Customer satisfaction: “I would recommend this product to others.” (Strongly Disagree to Strongly Agree)
Product usability: “This interface is easy to navigate.” (Strongly Disagree to Strongly Agree)
Employee engagement: “I feel valued in my role.” (Strongly Disagree to Strongly Agree)
Service quality: “Our support team resolved my issue quickly.” (Strongly Disagree to Strongly Agree)
Feature importance: “This feature is essential to my workflow.” (Strongly Disagree to Strongly Agree)
Likelihood to purchase: “I’m likely to buy this product.” (Strongly Disagree to Strongly Agree)
Brand perception: “This company is trustworthy.” (Strongly Disagree to Strongly Agree)
You can adapt these templates to any context. The structure stays the same: a clear statement and a symmetric scale.
When to use Likert scales versus alternatives
Likert scales are powerful but not always the right choice.
Use Likert scales when you want to measure attitudes, agreement, or satisfaction along a continuum. Use yes-no questions for quick, binary screening. Use ranking questions to compare priority between items. Use open-ended questions when you don’t know what options exist or need a detailed explanation. Use rating scales (1–10) when measuring a single dimension without the agreement/disagreement language of a Likert scale.
Many surveys benefit from mixing these approaches. Use yes-no questions to screen, Likert scales to measure attitude, and a few open-ended questions at the end to learn why.
Final takeaway
A Likert scale is one of the most versatile survey tools because it balances speed, clarity, and depth. It’s intuitive for respondents, straightforward to analyze, and reveals more than binary options without the time commitment of open-ended questions.
When you design a Likert scale well—with clear statements, symmetric scales, and consistent anchors—you get reliable data that informs real decisions. Test the survey before deploying, and you’ll get results you can trust.
Liked that? Check these out:
.webp)
.webp)
Opinions and Expertise
The rise of adaptive, momentum-driven journeys (and the fall of the static funnel)
Human behavior isn't a neat funnel—it's a constellation of scattered but connected moments. Adaptive, momentum-driven journeys act on these moments in real time to deliver a customer experience that naturally drives conversions. That's why they're replacing the familiar but dead static funnel.
Read more

Opinions and Expertise
Customer flows, not funnels: Why marketers are rethinking how customers move
Marketing funnels assume customers move in straight lines—but they don't. Customer flows use automated workflows to build momentum, with one action triggering the next. See how Typeform Contacts & Automations helps you meet customers where they are, automatically.
Read more