Bivariate analysis: How to find relationships in your data
Learn how bivariate analysis reveals relationships in your data, with practical examples, methods, and tips for turning survey results into better decisions.
Your satisfaction score looks healthy. That’s great. But new customers keep mentioning a confusing onboarding experience.
How can both be true?
An overall score only gives you one view. Compare satisfaction with customer tenure, and you get another. That second view may reveal a problem hiding inside that reassuring average.
Key takeaways
- Two variables, more context: Bivariate analysis helps you spot relationships that overall averages can hide, like differences in satisfaction between new and longtime customers.
- Match the method to your data: Use crosstabs to compare categories, scatter plots to explore numerical relationships, and group summaries to compare numbers across segments.
- A pattern is a starting point: Check sample sizes, uncertainty, and other possible explanations before drawing conclusions. Association doesn’t prove cause and effect.
- Give every finding a next step: Use what you learn to shape a follow-up question, investigate friction, or plan an experiment.
Bivariate analysis helps you explore two variables together, so you can move from “Here’s what people said” to “Here’s a relationship worth investigating.” You don’t need to become a statistician to get started.
You need a clear question, the right comparison, and a little curiosity.
What is bivariate analysis?
Bivariate analysis is the process of examining two variables to understand their relationship.
A variable is anything that can differ between observations: customer segment, purchase amount, satisfaction rating, or whether someone completed a form.
For example, you could compare:
- Customer tenure and satisfaction
- Device type and form completion
- Monthly product usage and monthly spending
- Subscription plan and preferred support channel
Each comparison answers a more specific question than either variable could alone.
Analyzing satisfaction by itself is univariate analysis. Comparing satisfaction with tenure is bivariate analysis. Examining satisfaction alongside tenure, plan, and support experience is multivariate analysis.
Bivariate analysis is a useful starting point because it keeps your question focused. You’re exploring one relationship at a time.
Why use bivariate analysis?
Averages are helpful, but they can hide differences that matter.
Imagine your customers generally describe onboarding as easy. Split those answers by subscription plan, though, and you may discover that one group consistently struggles.
Now you have a direction: investigate that group’s experience.
Bivariate analysis can help you identify audience differences, explore potential friction, and develop hypotheses for experiments. It also makes reporting more useful. “Satisfaction varies by customer tenure” gives your team something to investigate.
The key is beginning with a question that’s tied to a decision. “What relationships can we find?” is a big, messy starting point. “Should we improve onboarding for newer customers?” is easier to work with.
Choose a method that fits your variables
Before opening a spreadsheet, identify what kind of data you’re comparing.
Categorical variables describe groups, like device type or subscription plan. Numerical variables measure quantities, like spending or time.
Ratings need some care: ordered options have a sequence, but the distance between them isn’t necessarily equal. Here’s a practical starting guide:
- Two categorical variables (example: plan and preferred support channel): start with a cross-tabulation and percentage comparison.
- Two numerical variables (example: product usage and spending): start with a scatter plot and correlation.
- One categorical and one numerical variable (example: customer segment and purchase amount): start with group summaries and box plots.
Two categorical variables: compare groups
A cross-tabulation, or crosstab, shows how answers to one variable break down across another.
Say you want to compare support preferences between monthly and annual subscribers. Your table can show how many people in each group prefer email, chat, or phone support.
Compare percentages within each group, too. Raw counts can mislead when one subscription group is much larger.
If you need to assess evidence of an association, a chi-square test of independence may be appropriate. It works with counts, and you’ll need to check its assumptions, including independent observations and large enough expected counts in each cell.
Two numerical variables: look for a pattern
Want to explore whether customers who use your product more also spend more? Start with a scatter plot.
Each dot represents an observation, with one variable on each axis. Look for an upward pattern, a downward pattern, curves, clusters, or unusual points. NIST’s scatter plot guide explains how these charts reveal relationships.
Pearson’s correlation coefficient summarizes the direction and strength of a linear relationship, from -1 to +1. A value near 0 means little linear association, but a curved relationship could still exist.
Spearman’s correlation can help with ranked data or relationships that consistently move in one direction without following a straight line.
One categorical and one numerical variable: compare distributions
Suppose you’re comparing purchase amounts across customer segments.
Calculate each group’s average and median, then examine the spread. A box plot can reveal whether a few unusually large purchases are pulling one group’s average upward. Depending on your question and data, a t-test, ANOVA, or a suitable alternative can help assess group differences.
That chart and summary should come first. They help you understand what any later test is actually comparing.
3 bivariate analysis examples from Typeform research
Let’s bring this closer to the forms and surveys you work with.
What does bivariate analysis look like in practice? We analyzed 882.5 million form starts across 2.38 million Typeform forms from September 2025 to August 2026. These 3 examples show how exploring relationships in your data can reveal patterns and help you decide what to investigate next.
Form length and completion
Forms with 1 to 3 questions had a 75.68% completion rate, compared with 54.04% for forms with 11 or more questions.
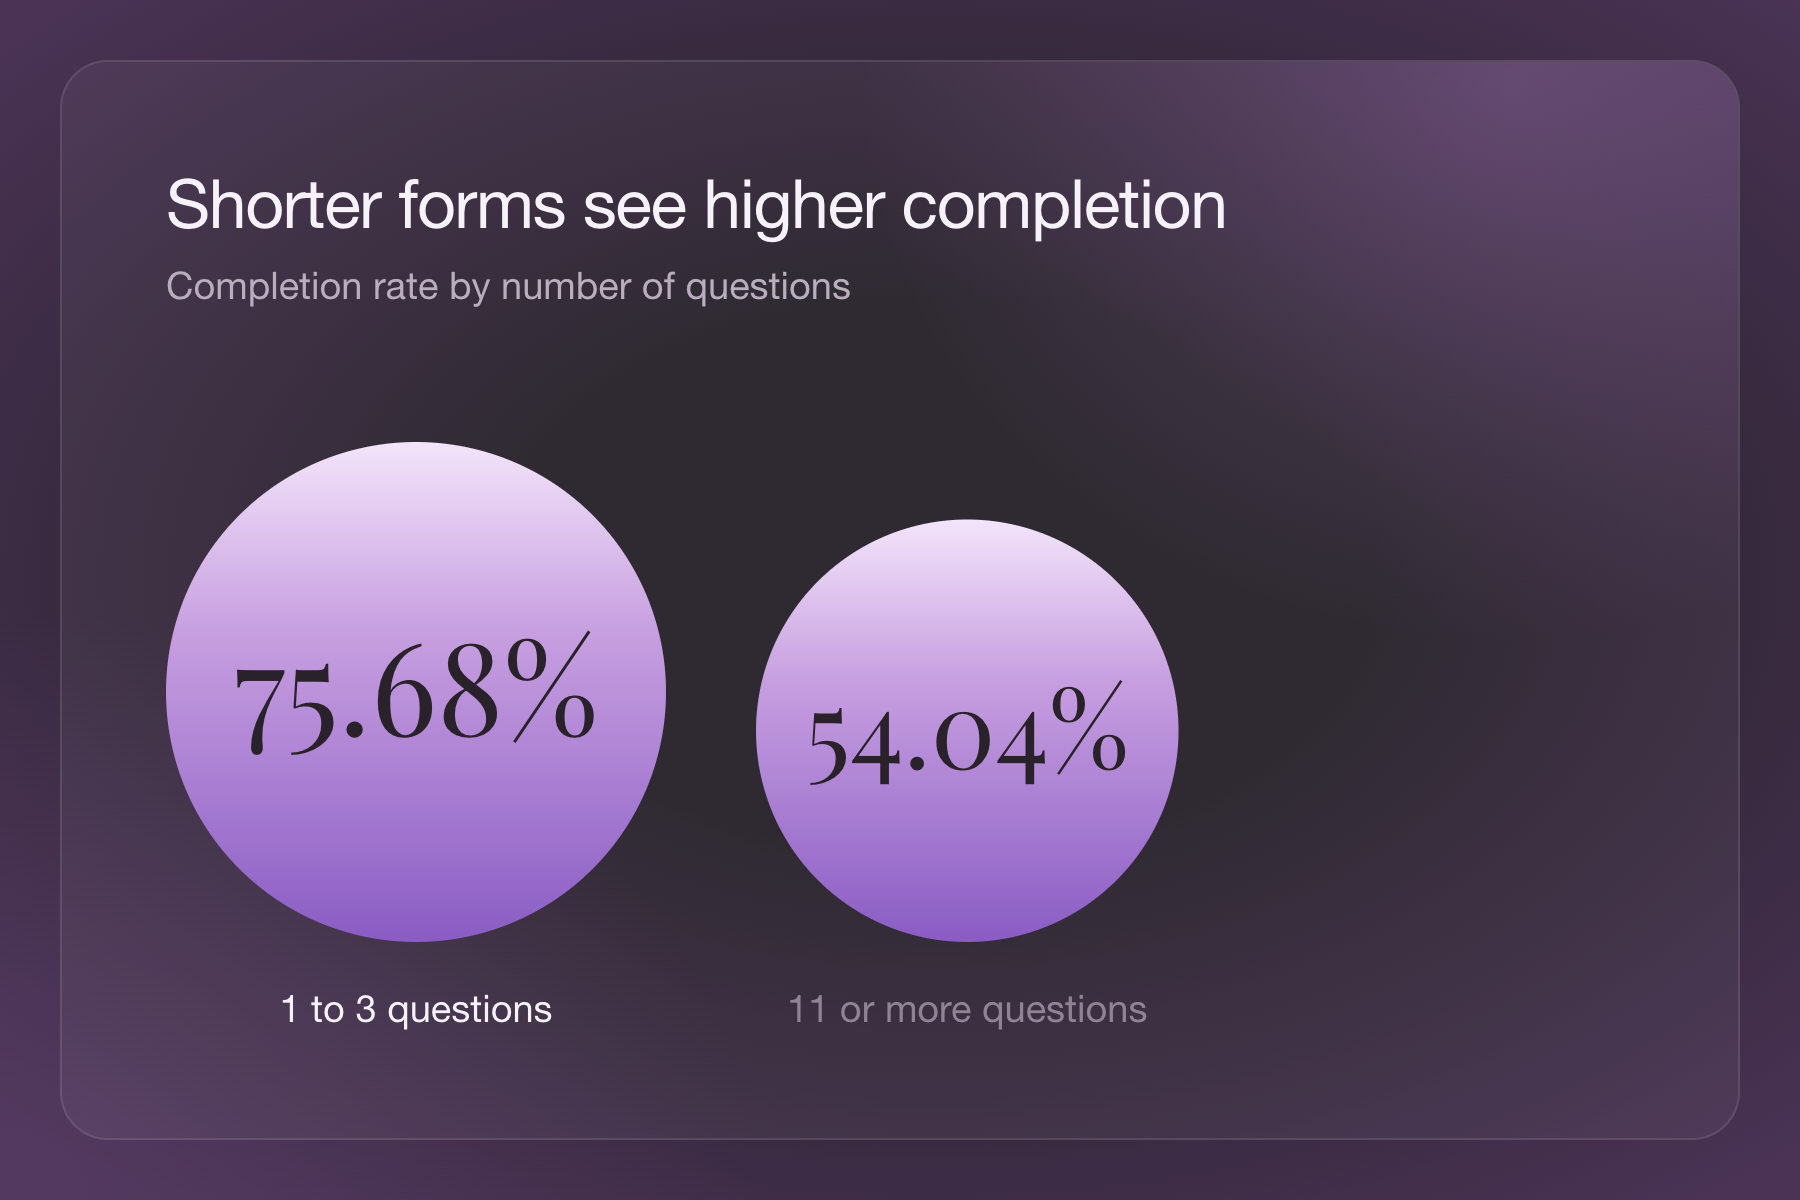
Here, you’re comparing question-count bands with completion outcomes. That relationship gives you a reason to review a longer form. Which questions support your decision? Which are just nice to know?
That doesn’t mean shortening your form will automatically deliver the same results. A quick feedback survey and a detailed application serve different purposes and audiences. Treat that pattern as a hypothesis, not a promise. Then apply sound survey design practices and test a focused change.
Device type and completion
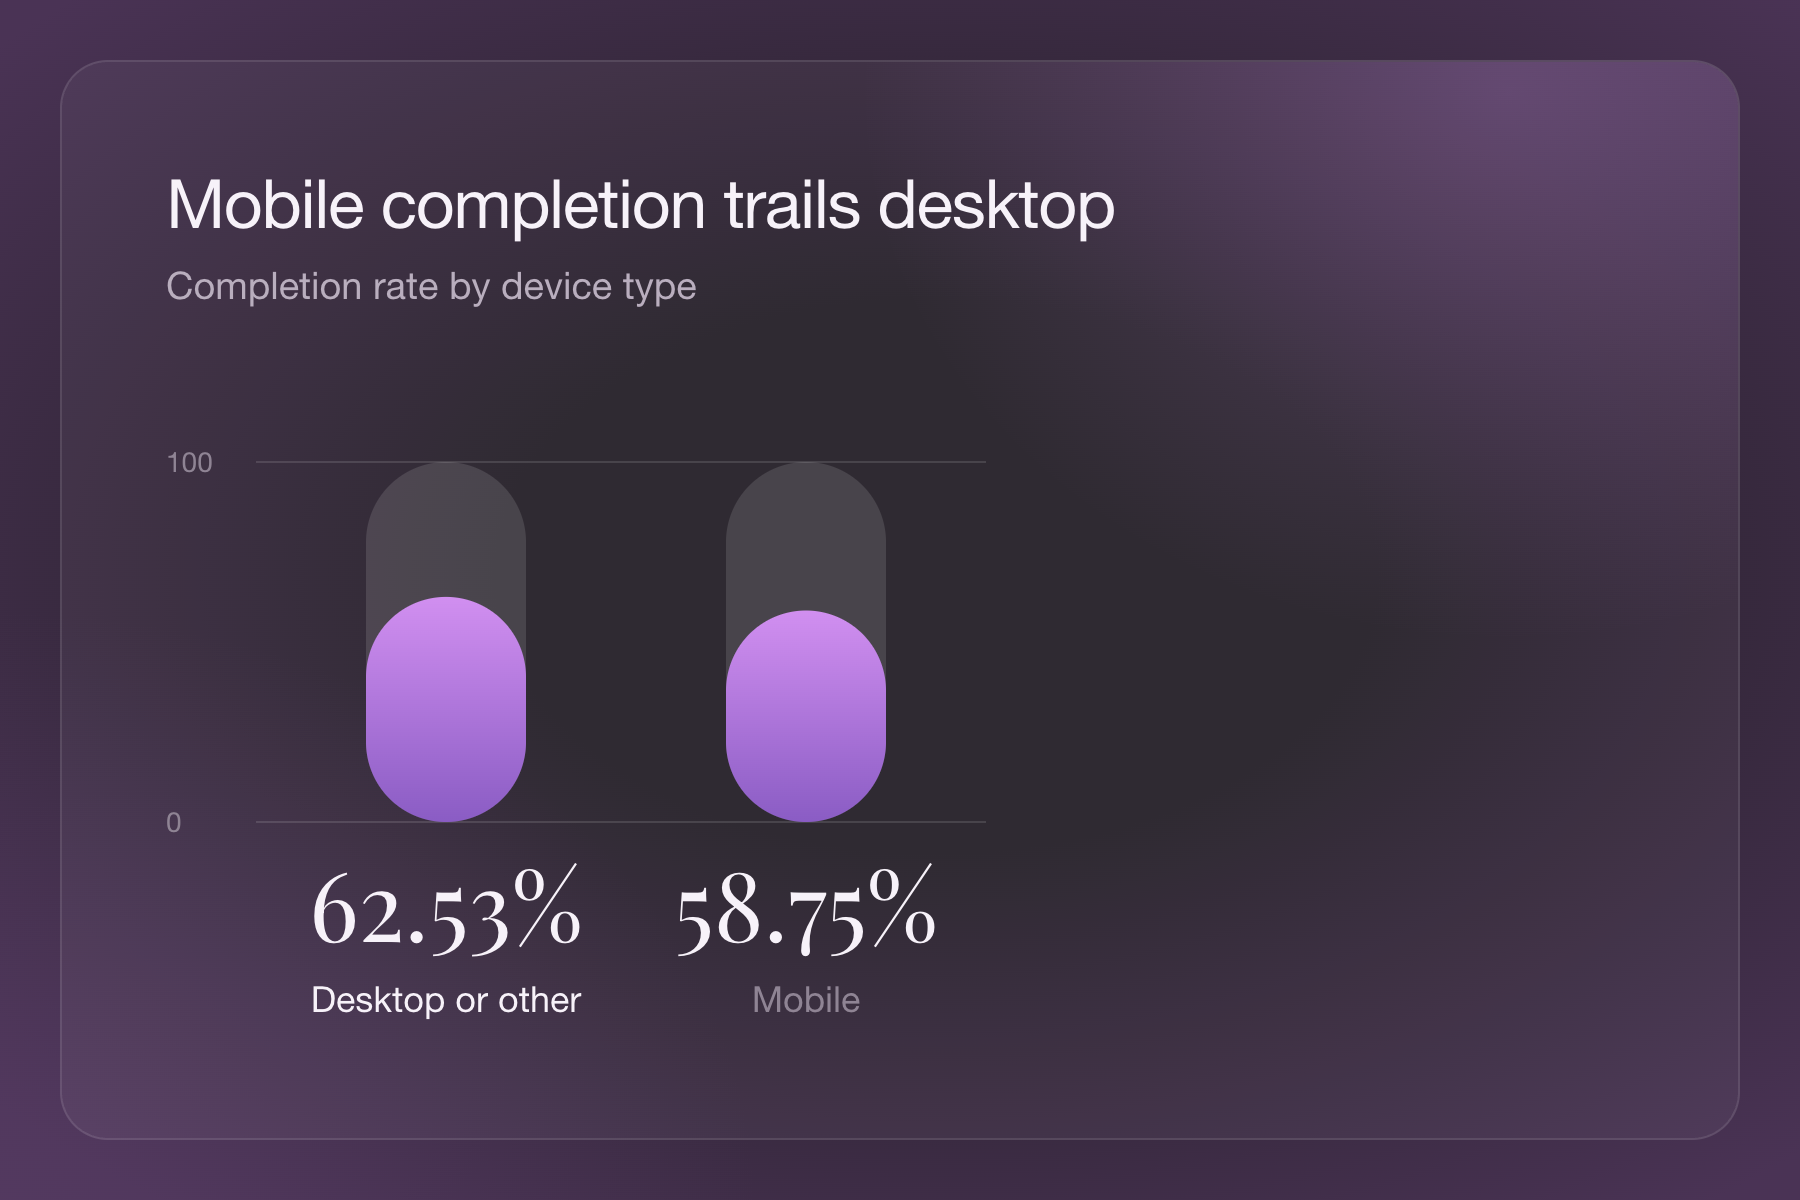
Mobile form starts had a 58.75% completion rate, compared with 62.53% for desktop or other devices.
This comparison connects a categorical variable, device type, with whether a form was completed. It suggests a practical investigation: walk through your form on a phone. Are answer options easy to select? Does a question require information people may not have handy?
The benchmark doesn’t tell you why the difference exists. Mobile and desktop audiences may arrive through different channels or have different intentions.
Your next step is to see whether the same pattern appears in your own data.
Phone-number fields and completion
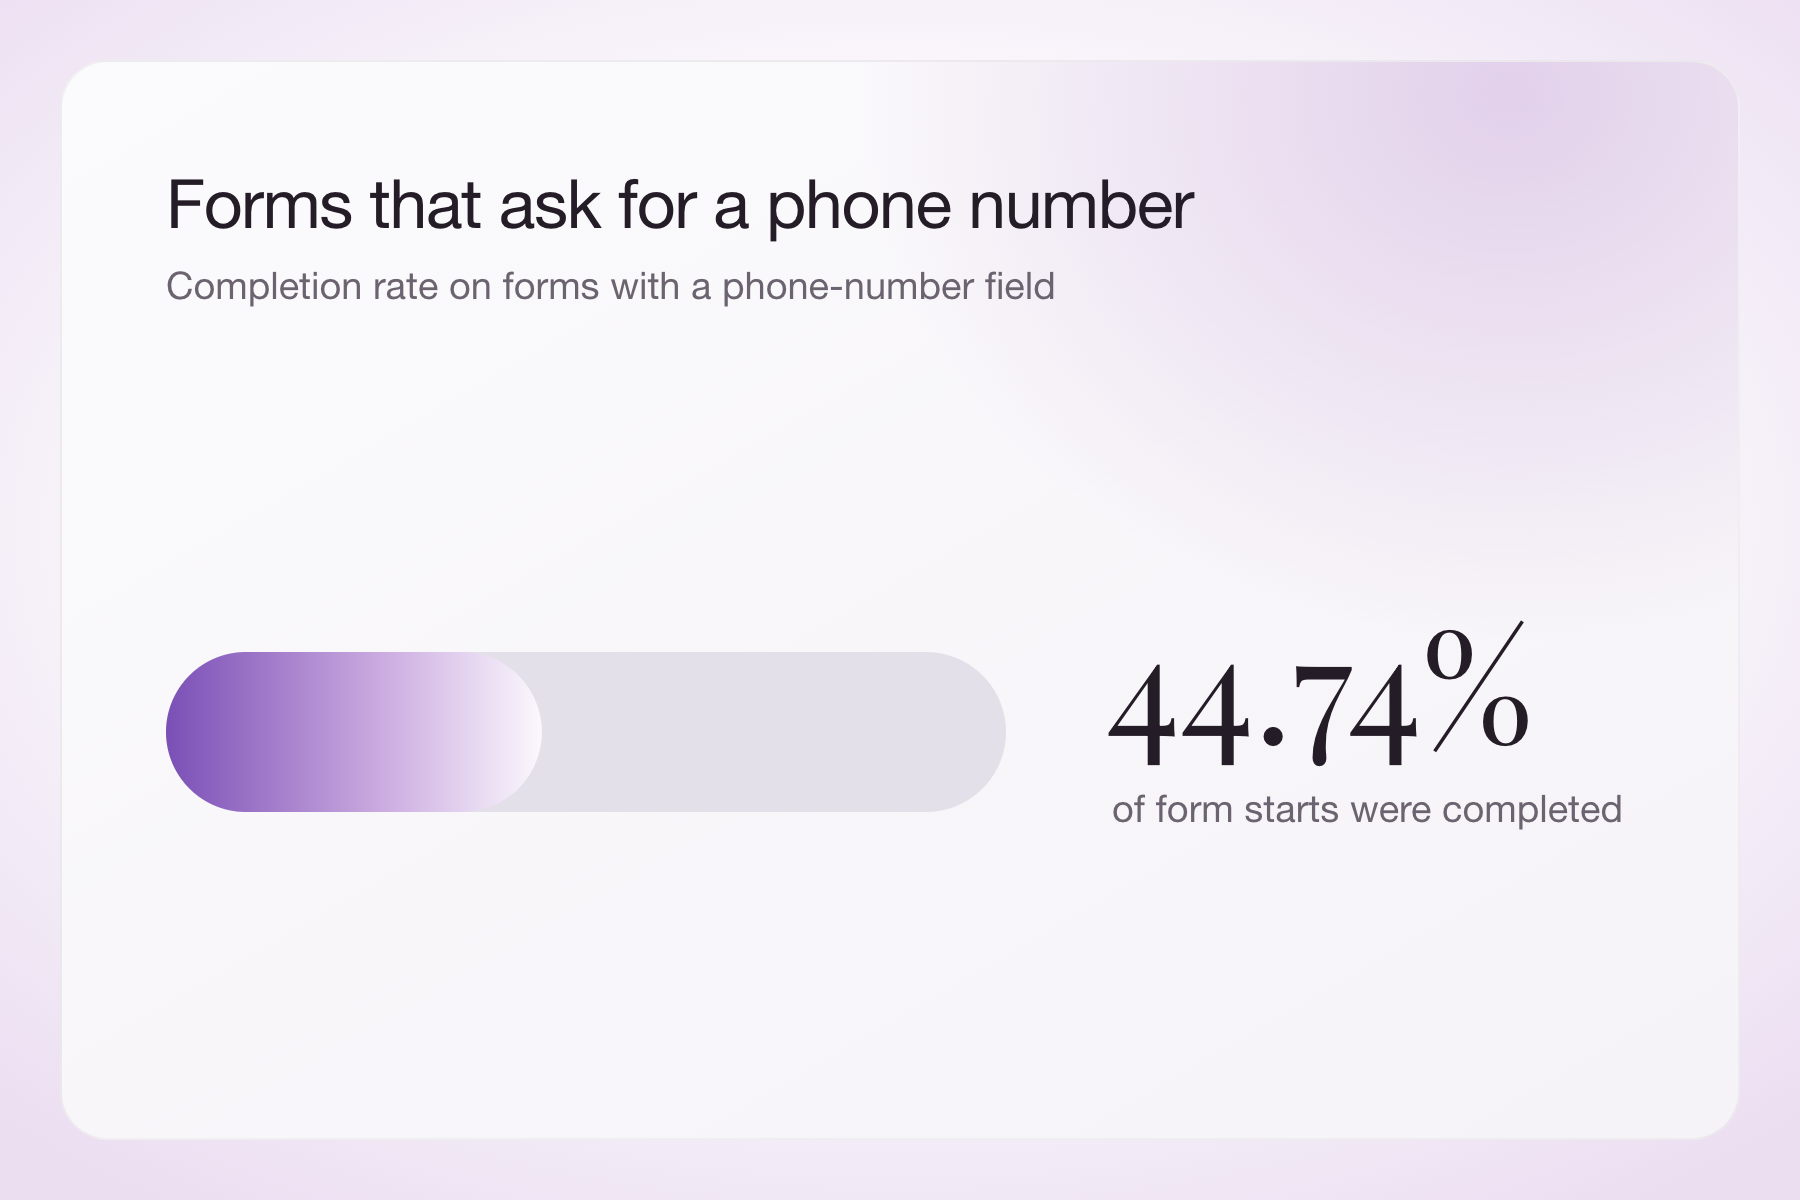
Forms containing a phone-number field had a 44.74% completion rate.
To put that figure in context, compare it with the completion rate for forms without a phone-number field. That’s where bivariate analysis comes in: you’re exploring whether including the field is associated with completion.
If you find a difference, look closely before drawing conclusions. These rates reflect completion of the entire form, and differences in length, purpose, or audience could also explain the gap.
There’s also a practical question worth asking: Do you need a phone number at this stage? Thoughtful survey question writing starts with knowing what each answer will help you do.
How to run your own bivariate analysis
Is there a relationship you want to explore? Here’s how to turn that curiosity into a clear comparison, check what the results mean, and decide what to do next.
Write one specific question
Try: “Does onboarding satisfaction differ between new and established customers?”
Define “new” before reviewing the results. Otherwise, it’s tempting to keep changing your groups until an interesting difference appears.
Prepare paired data
Each row should represent the same kind of observation, with both variables recorded together. For customer feedback, that could mean one row per respondent, with tenure in one column and satisfaction in another.
Check for duplicates, inconsistent labels, missing answers, and unusual values. Don’t treat a blank satisfaction response as zero. Our guide to analyzing survey data covers preparation in more detail.
Visualize, then measure
Choose the chart and method that fit your variables. Include group sizes alongside percentages or averages.
If you run a statistical test, report the size of the relationship and its uncertainty, too. The American Statistical Association’s statement on p-values explains why statistical significance alone doesn’t tell you whether a result matters.
Challenge your first explanation
Could another factor explain the pattern? Are respondents representative of the people you want to understand? Did repeated responses come from the same customers?
A large data set won’t automatically remove bias. And the more relationships you check, the more likely one will look interesting by chance alone.
Choose a next step
Your finding should lead somewhere: a follow-up question, a customer interview, a design review, or an experiment. If you need to account for several factors together, move beyond a two-variable comparison.
Turn a relationship into a better question
Bivariate analysis helps you get more from the information people share. Start small: choose two variables, make a fair comparison, and investigate what might explain the result.
Ready to collect the answers? Build a focused survey with Typeform’s survey maker, then use what you learn to decide what to explore next.