Customer experience metrics: What to measure and why
Track the customer experience metrics that move revenue: CSAT, NPS, CES, retention rate, churn, CLV, and NRR, with benchmarks and formulas for each.
Great customer experiences don’t happen by accident. They’re built on data—the kind you gather by tracking how people interact with your brand, what frustrates them, and what makes them want to come back.
Customer experience metrics are the measurements that tell you whether you’re hitting the mark. They answer questions like: Are customers satisfied? Are they staying loyal? Do they feel heard? Without these metrics, you’re making decisions in the dark.
This guide covers the metrics that matter most, why they matter, and how to use them to build experiences people actually enjoy.
What are customer experience metrics?
Customer experience metrics—often called CX metrics—are quantifiable data points that measure how satisfied, loyal, and engaged your customers are at every stage of their relationship with your brand.
Unlike vanity metrics (like social media followers), CX metrics directly impact your bottom line. They tell you how well your product, service, or support is working from the customer’s perspective. They also reveal where you’re losing people and where you’re winning.
A metric could be a percentage, a score, a rate of change, or a count. The key is that it answers a specific business question and tells you whether to keep doing what you’re doing or pivot.
The core customer experience metrics you should track
Customer satisfaction score (CSAT)
CSAT asks a simple question: “How satisfied are you with your recent interaction?” Respondents usually rate their answer on a scale of 1 to 5 or 1 to 10.
The metric itself is the percentage of customers who gave a positive rating (typically 4 or 5 out of 5). A CSAT of 78% or higher is solid (American Customer Satisfaction Index (2024-2025)). Scores above 80 are excellent; below 70 signal real problems that need fixing.
When to use it: After a purchase, support interaction, or service experience. It’s quick to measure and easy for customers to answer.
What it tells you: Whether customers are happy with a specific moment in their journey. It’s a snapshot, not a long-term view.
Net Promoter Score (NPS)
NPS asks: “How likely are you to recommend us to a friend or colleague?” on a 0-to-10 scale. You then categorize respondents into three groups:
- Promoters (9-10): Your loyal advocates. They’ll refer others.
- Passives (7-8): Satisfied but not enthusiastic. They could switch if something better comes along.
- Detractors (0-6): Unhappy customers who may damage your reputation.
Your NPS is calculated as the percentage of promoters minus the percentage of detractors. It ranges from -100 to +100.
When to use it: Regularly, across your entire customer base. Unlike CSAT (which measures a single moment), NPS measures overall loyalty.
What it tells you: Whether customers would stake their reputation on you. This is a leading indicator of retention and growth.
Customer effort score (CES)
CES measures how easy (or hard) it is for customers to do business with you. The question is typically: “How easy was it to resolve your issue?” on a 1-to-5 or 1-to-7 scale.
The metric is the percentage of customers who rated their effort as low (usually a 4 or 5 on a 5-point scale). Aim for 75% or higher.
When to use it: After support interactions, onboarding, or checkout. Any moment where friction matters.
What it tells you: Whether your processes are streamlined or bloated. Low effort scores predict retention and loyalty.
Customer retention rate
This one’s straightforward: What percentage of your customers stay with you over a specific period?
Formula: (Customers at end of period – New customers acquired) / Customers at start of period × 100.
When to use it: Track it monthly, quarterly, and annually. It’s one of your most important health metrics.
Why it matters: Acquiring new customers costs 5 times more than retaining existing ones (Firework (2025)). A 5% increase in retention can lead to a 25-95% increase in profits. Existing customers also spend 67% more than new customers and generate 65% of your revenue.
Customer churn rate
Churn is the inverse of retention. It’s the percentage of customers who leave in a given period. Calculate it the same way as retention, then subtract from 100%.
Even small improvements in churn pay huge dividends. Customer churn costs US businesses $136 billion annually (Firework (2025)). Brands with strong loyalty programs report 12-18% revenue increases.
When to use it: Track it constantly. High churn means you’re leaking revenue faster than you can plug it.
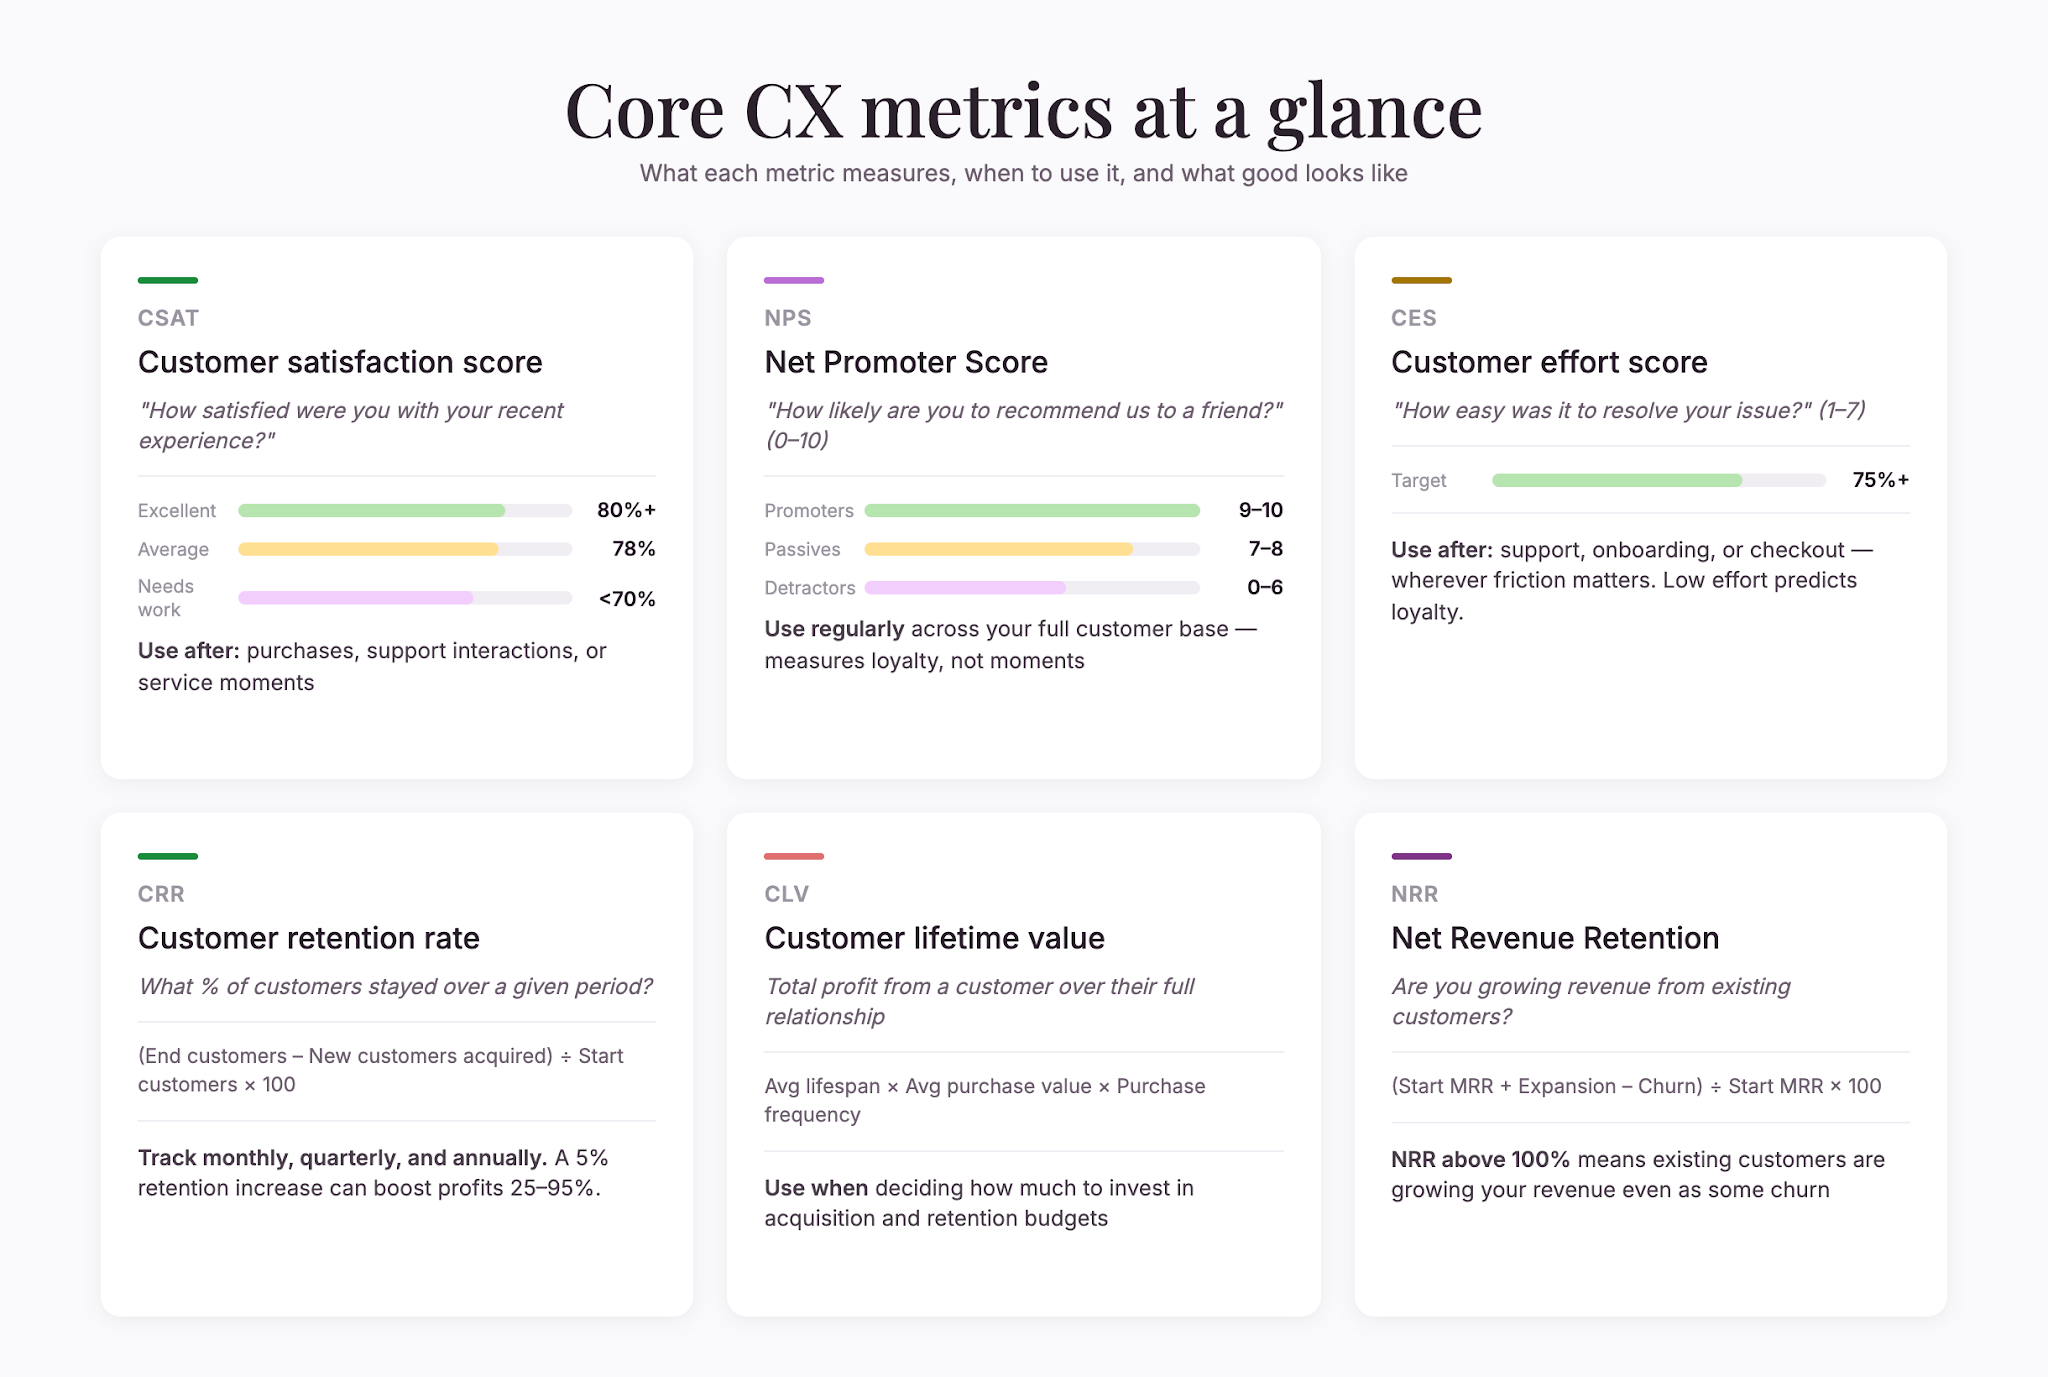
Customer lifetime value (CLV)
CLV estimates the total profit a customer will generate over their entire relationship with your brand. It’s a forward-looking metric that helps you decide how much to invest in acquiring and retaining that customer.
Formula: Average customer lifespan × Average purchase value × Purchase frequency.
When to use it: When making long-term investment decisions. It’s especially useful if you offer subscription or recurring services.
Why it matters: A customer with high CLV is worth more than a cheap acquisition. This metric guides your acquisition spending and retention budgets.
Net Revenue Retention (NRR)
NRR measures how much revenue you’re keeping and growing from existing customers, accounting for churn and upsells. It’s critical for subscription businesses.
Formula: (Beginning MRR + Expansion revenue – Churn revenue) / Beginning MRR × 100.
An NRR above 100% means you’re growing revenue from existing customers even as some churn. This is a sign of strong product-market fit.
When to use it: If you have recurring revenue. It’s one of the healthiest indicators of business trajectory.
Why customer experience metrics matter
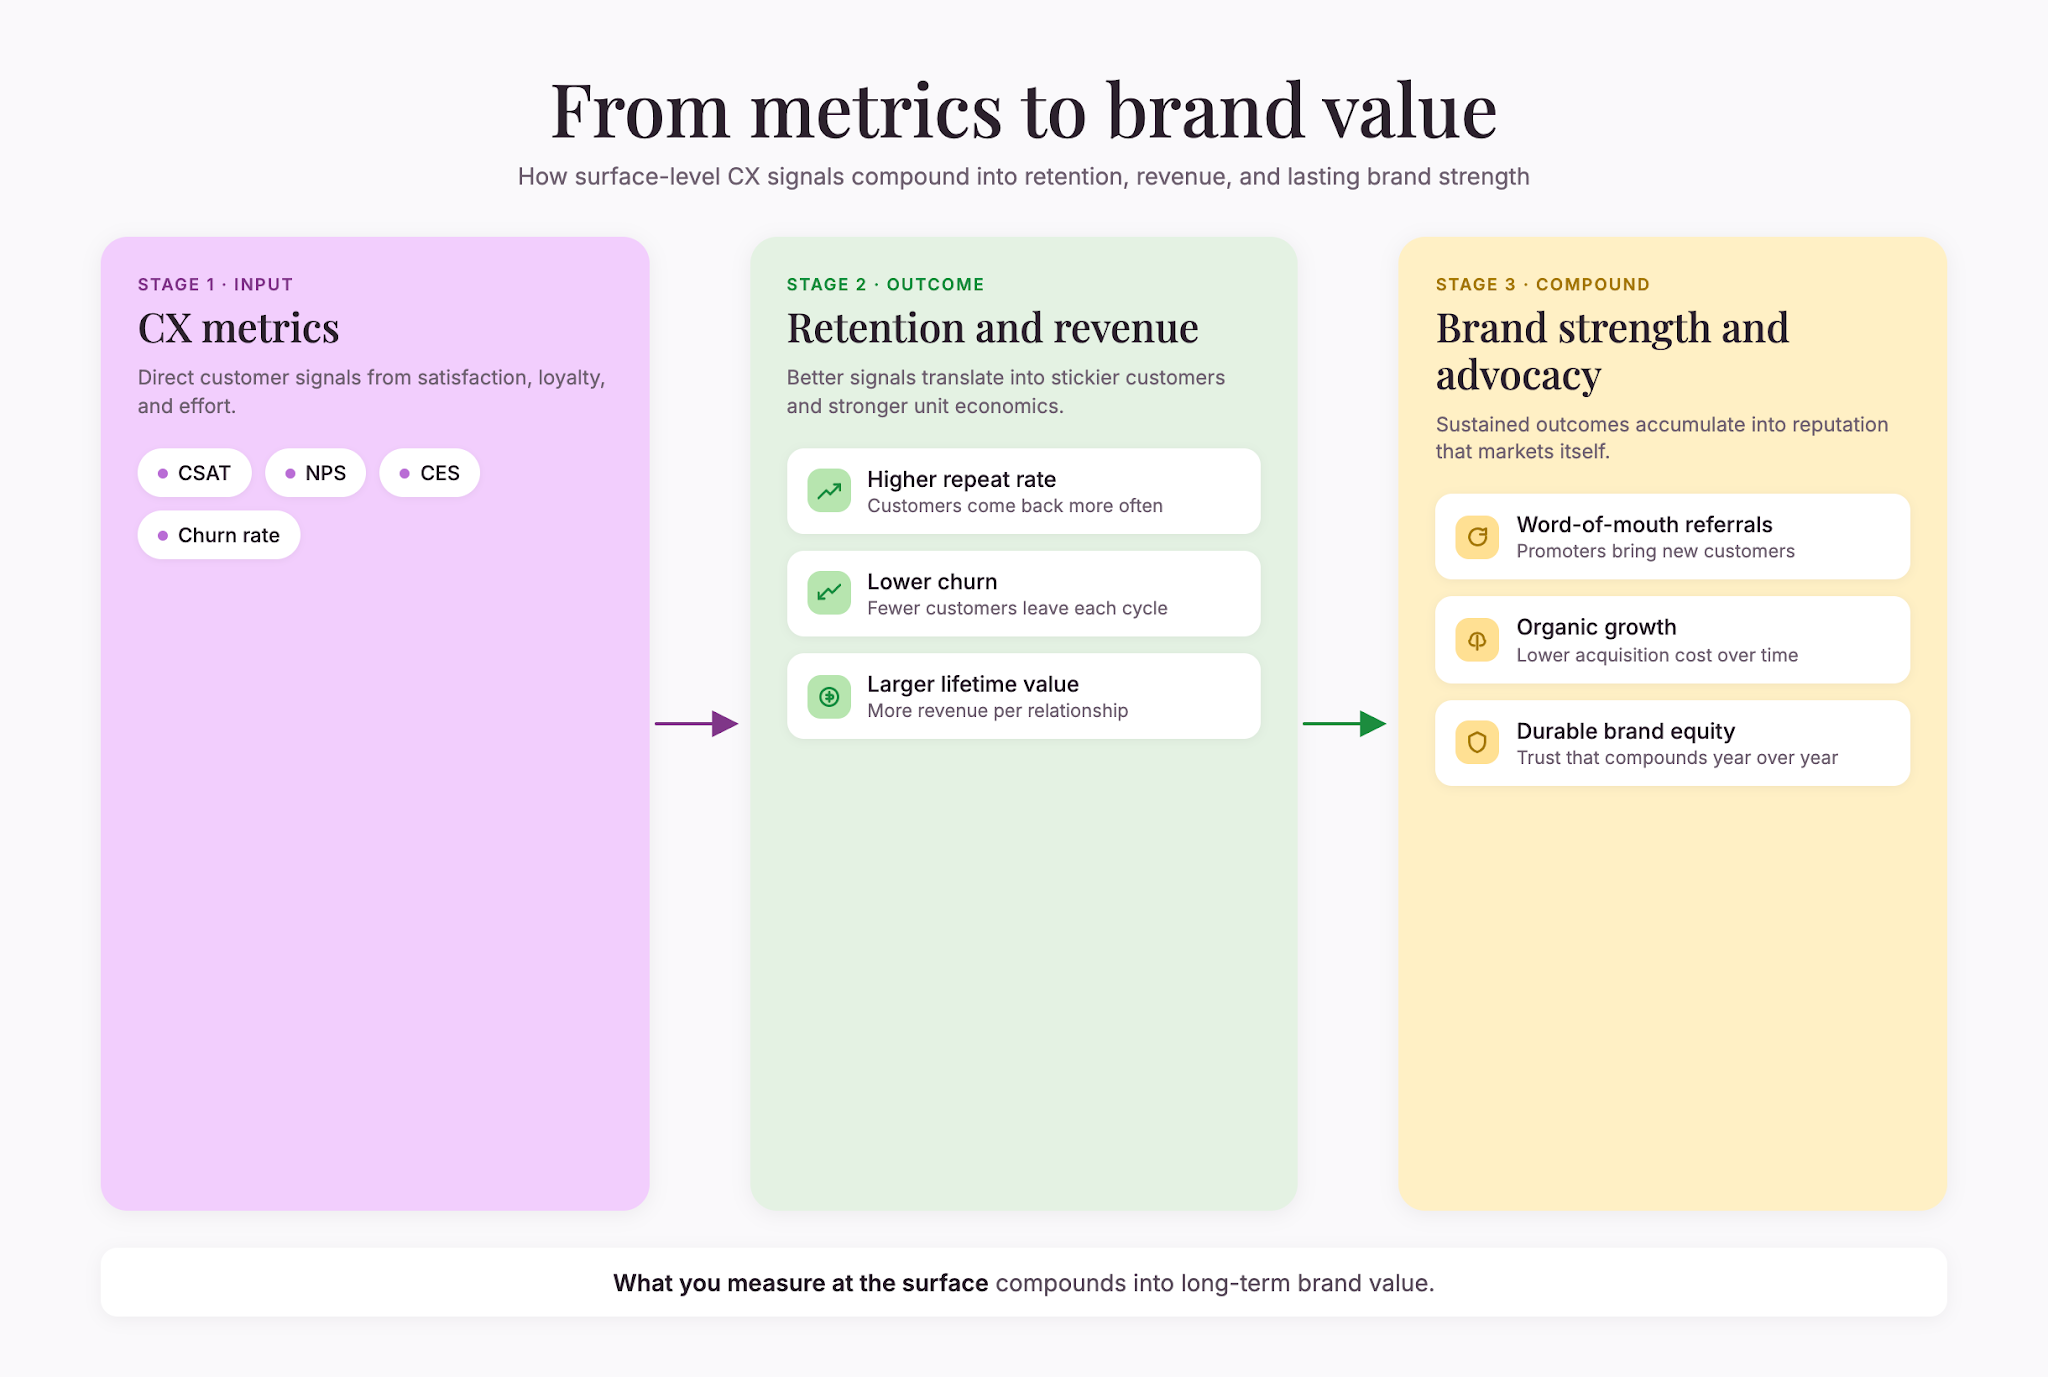
They connect to profit
The relationship is direct. Better retention rates mean lower acquisition costs. Higher satisfaction scores predict lower churn. 81% of consumers need to trust a brand to consider buying from it (WiserNotify (2025)). That trust comes from good experiences, and good experiences are measurable.
When you know your metrics, you can invest in the areas that actually move the needle on revenue—not guesses, not hunches.
They reveal blind spots
Most teams think they’re delivering a better experience than they actually are. Metrics strip away the opinion layer and show you reality. If your CES is low, customers are struggling—even if your support team thinks they’re being helpful.
They enable faster iteration
You can’t improve what you don’t measure. A clear baseline—“our CSAT is 72%”—gives you a target. You then run changes, measure the impact, and keep what works.
They build accountability
When metrics are tracked and shared, everyone on the team knows what they’re optimizing for. Product teams adjust features. Support teams refine processes. Marketing teams refine messaging. Everyone pulls in the same direction.
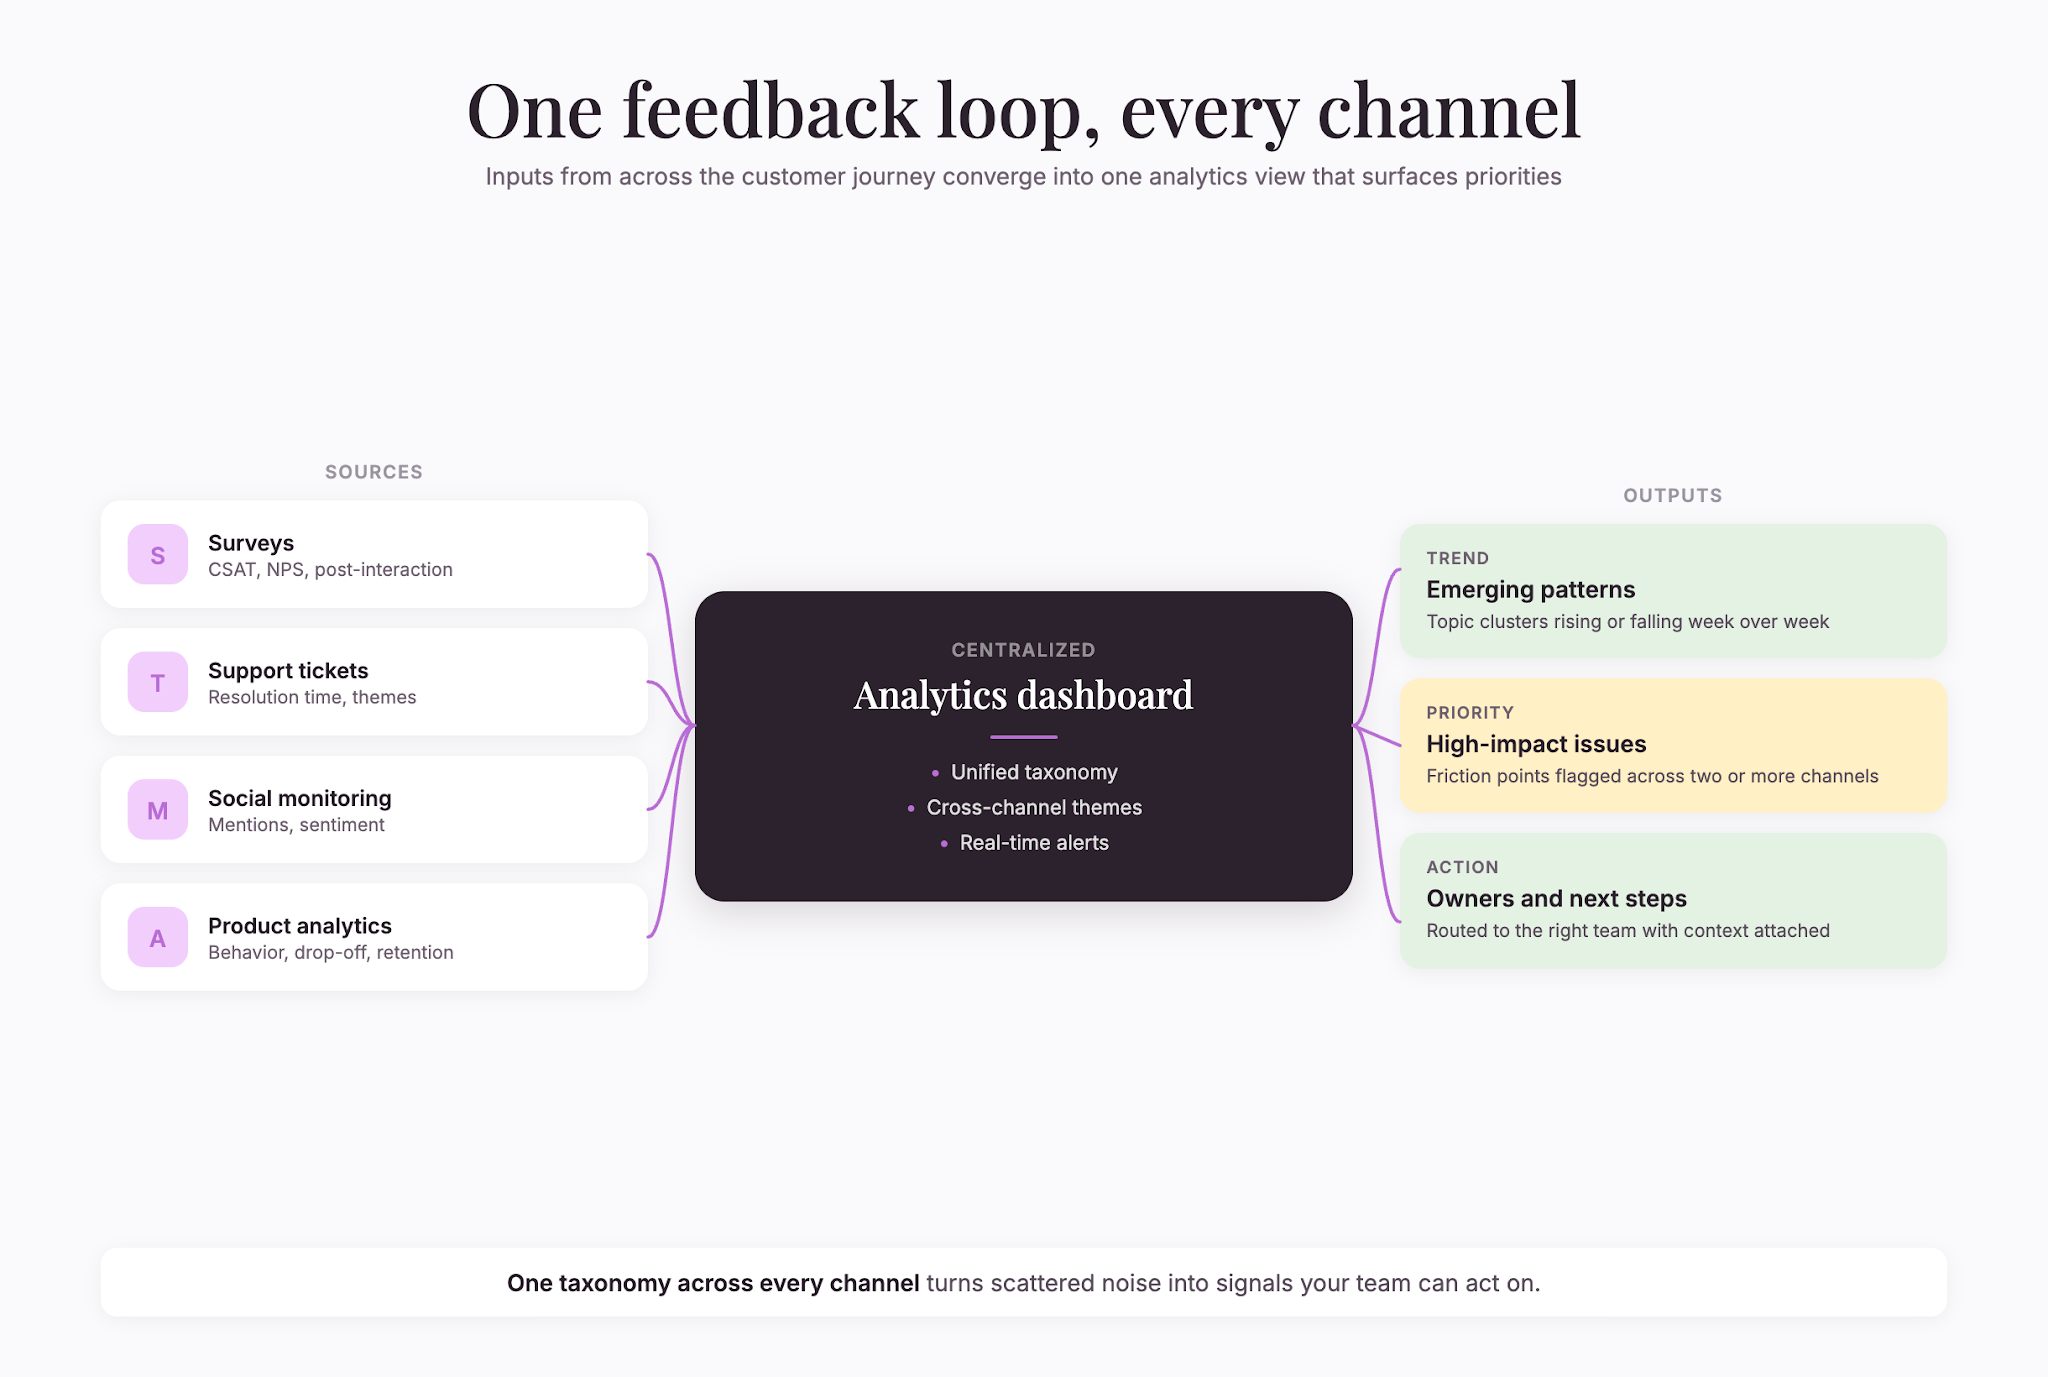
How to collect customer experience data
The most useful metrics come from direct customer feedback. Here are the main channels:
Surveys. Send short post-interaction surveys (CSAT and CES), regular NPS surveys, or deeper feedback forms. Keep them brief—more than 5 questions drops response rates sharply.
Support tickets and chat transcripts. Mining your support systems reveals common pain points and sentiment trends over time.
Customer interviews. Qualitative data from one-on-one conversations explains the “why” behind metric scores. A low CES score doesn’t tell you why checkout was hard; an interview will.
In-app feedback. Pop-up prompts, feedback buttons, and rating widgets capture feedback at the moment of experience.
Social media and review sites. Track mentions, reviews, and sentiment across public channels. This is often raw feedback that customers wouldn’t give you directly.
Behavioral data. Completion rates, time-on-page, drop-off points, and feature adoption all signal whether users are having a smooth experience.
Modern customer feedback platforms integrate multiple collection channels—surveys, reviews, support tickets, chats, and in-app feedback—alongside AI-powered analytics and case management automation. This consolidation makes it easier to connect feedback to action.
Setting targets and benchmarking
Metrics are only useful if you have something to compare them against. Here’s how to set realistic targets:
Understand industry baselines. Average CSAT across industries is 78% (American Customer Satisfaction Index (2024-2025)). Full-service restaurants lead at 84%, banks and e-commerce at 80%, while ISPs lag at 68%. Know where your industry typically sits.
Measure your current state. Start tracking now, even if the number feels low. You need a baseline to measure improvement against.
Set incremental goals. Don’t expect a 20-point CSAT jump in a month. Plan quarterly or annual targets. A 2-5% improvement per quarter is ambitious but achievable.
Segment by customer type. High-value customers, new customers, and long-term customers may have different satisfaction levels. Track them separately.
Review monthly, adjust quarterly. Some metrics (like churn) need frequent monitoring. Others (like CLV) move more slowly. Pick a cadence that matches the metric.
Common pitfalls to avoid
Chasing the wrong metrics. Not all metrics are equal. NPS, retention, and revenue impact are business-moving metrics. Vanity metrics feel good but don’t predict success. Focus on leading indicators that predict future outcomes.
Measuring without acting. A metric sitting in a dashboard nobody reads is worthless. Make data visible to the teams that can act on it.
Ignoring context. A dip in CSAT might be due to a system outage, not your product. Always investigate before panicking.
Confusing correlation with causation. A dip in NPS and a product launch might coincide, but one didn’t necessarily cause the other. Look deeper.
Setting unrealistic targets. “Achieve 95% CSAT” is harder than “improve CSAT from 72 to 78%.” Incremental is sustainable; aggressive pushback creates burnout and fudged numbers.
What happens when you actually use these metrics
Teams that track customer experience metrics seriously see real changes:
- They catch issues early instead of losing customers through attrition.
- They justify investment in customer-facing improvements (onboarding, support, product design) with data.
- They attract and retain customers who feel heard and valued.
- They celebrate CSAT scores that prove the team’s work is paying off.
The brands that win aren’t the ones guessing. They’re the ones measuring, learning, and iterating based on what their data tells them.
Key takeaway
Customer experience metrics translate how people feel into numbers you can act on. You don’t need to track every metric—pick the ones that matter most to your business model and your strategy. Measure consistently, share results with your team, and use the data to make incremental improvements.
Over time, better metrics compound into stronger retention, higher lifetime value, and a reputation that sells itself.

.png)