Longitudinal surveys: How to track change over time
A longitudinal survey tracks how attitudes shift across multiple waves. Covers panel, cohort, and trend designs, plus bias controls and attrition planning.
Understanding how attitudes, behaviors, and opinions shift is one of the most powerful—and underutilized—ways to make smarter decisions. A longitudinal survey lets you watch your audience evolve, spot emerging trends before they peak, and understand the forces driving real change.
This guide covers what longitudinal surveys are, why they matter, how to design them properly, and how to extract real insight from the data you collect over weeks, months, or years.
What is a longitudinal survey?
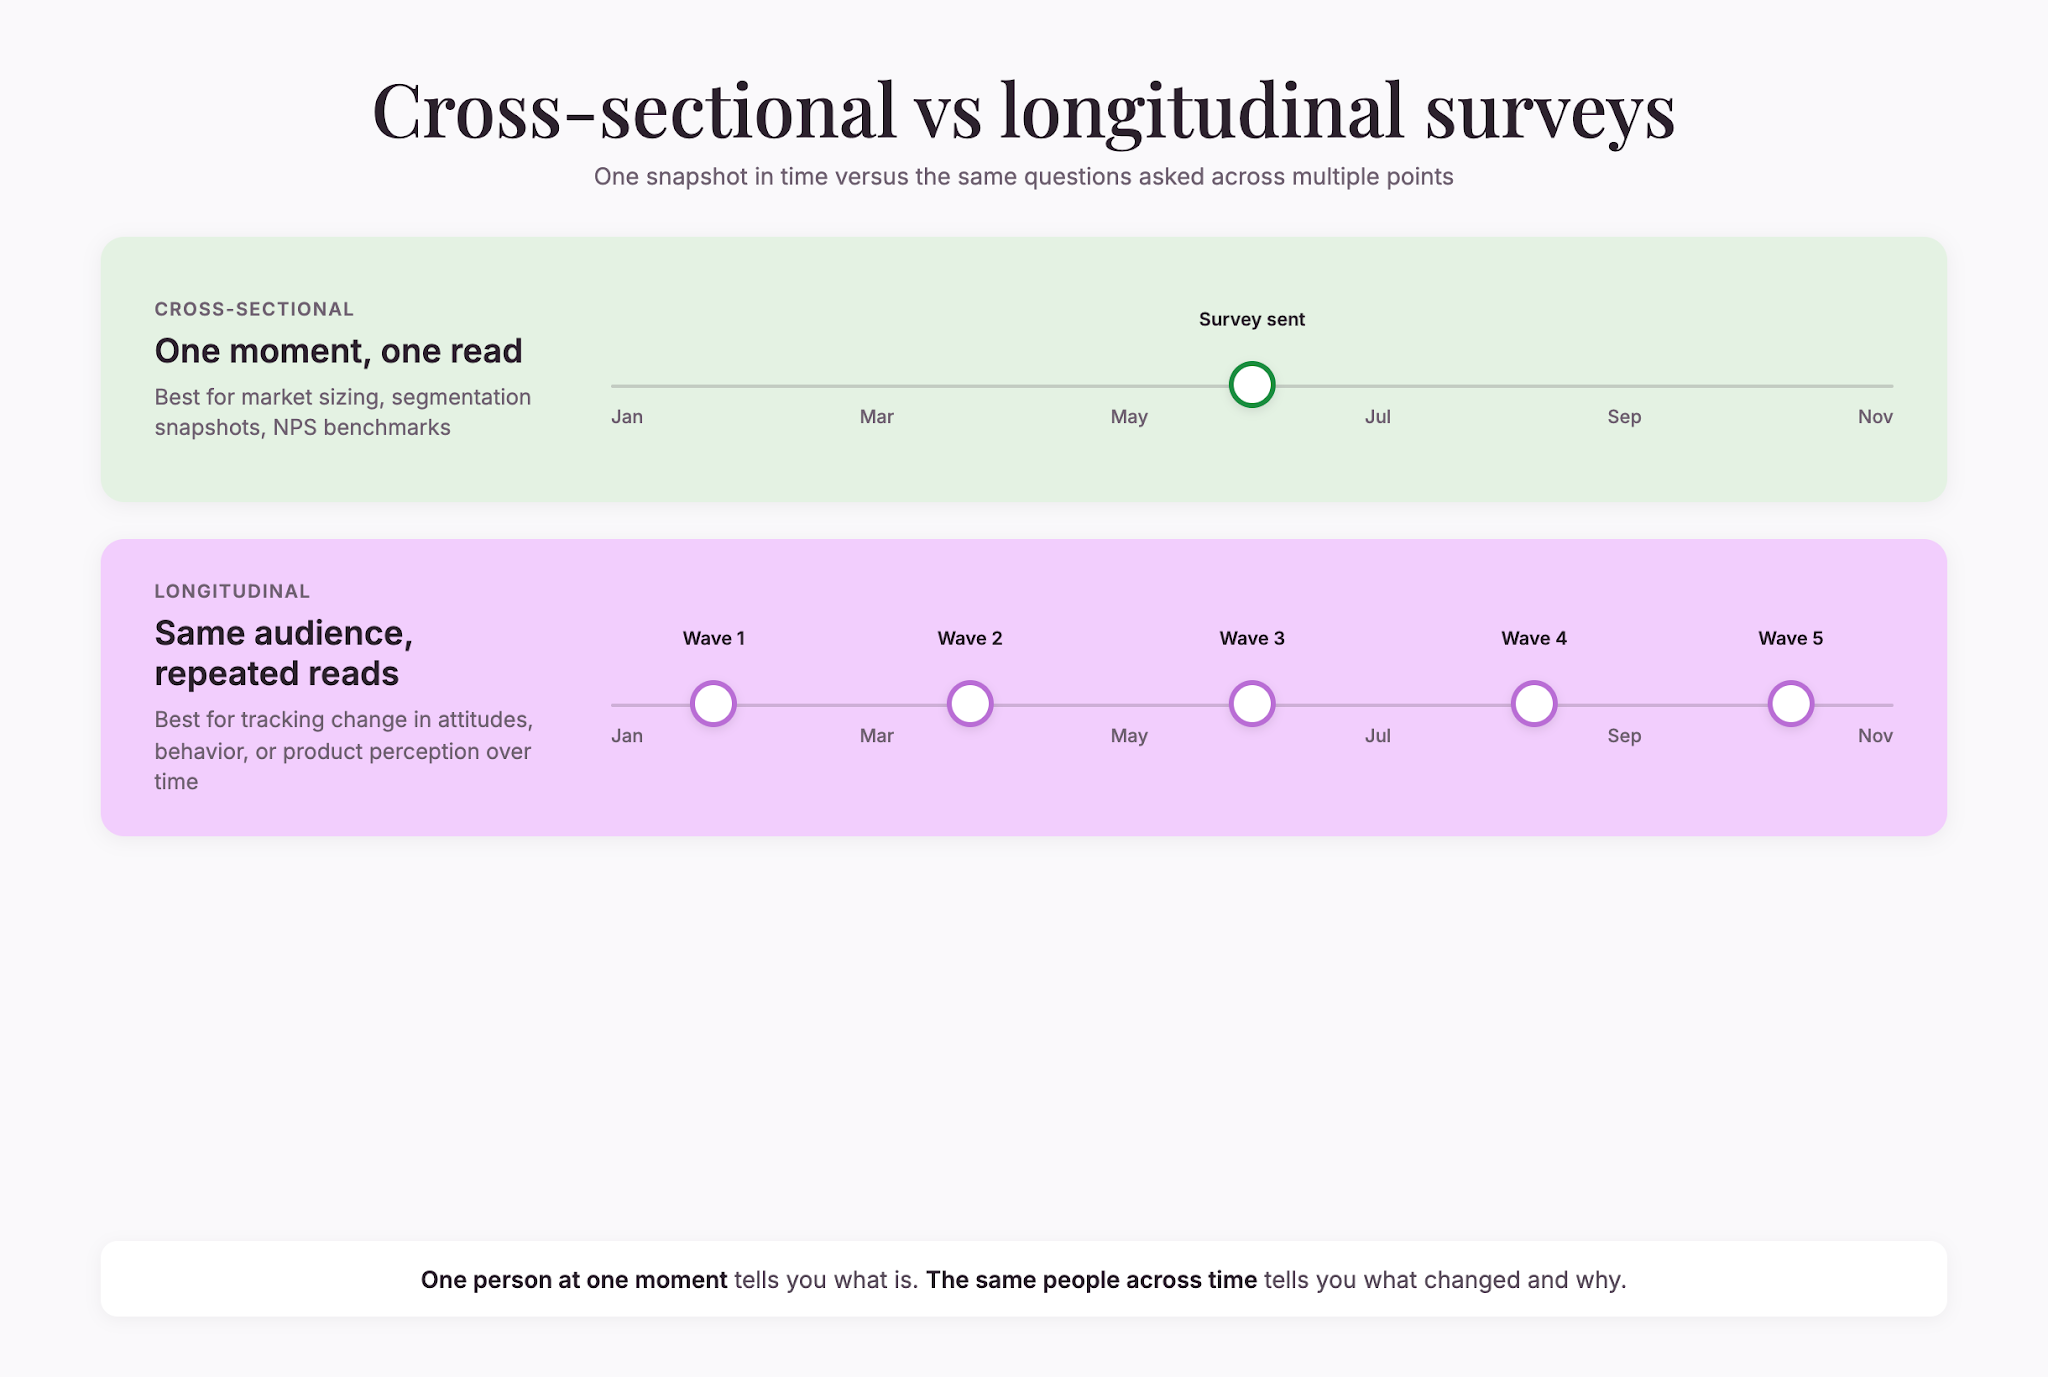
A longitudinal survey asks the same people the same (or very similar) questions multiple times over an extended period—weeks, months, or even years. The repeated contact with the same respondents is what sets them apart from other survey types.
The alternative is a cross-sectional survey, which measures a population at a single point in time. But a longitudinal survey shows you the trajectory; not just what people think or do right now, but how that thinking or behavior changes.
Think of it this way: a cross-sectional survey tells you the temperature today. A longitudinal survey shows you the weather pattern over a season.
Why track change over time?
There are several compelling reasons to invest in longitudinal data.
Spot real trends before they stabilize
By checking in with the same people repeatedly, you catch shifts early. Brand sentiment drifts before it plummets. Customer satisfaction slides before churn accelerates. Longitudinal surveys give you the early warning system.
Understand causation, not just correlation
Cross-sectional data can show you that two things move together. Longitudinal data lets you see how they move together and in what order. Measuring the same person’s behavior and beliefs over time brings you closer to understanding what’s driving what.
Reduce noise from one-off events
A single survey can be skewed by the day you sent it—maybe there was a PR crisis that morning, or good news broke the night before. Repeated measurement smooths out these one-time blips and reveals the underlying pattern.
Build richer customer and audience profiles
When you know how someone’s preferences, needs, or behaviors have evolved, you can segment and target them more precisely. You’re tracking who they’re becoming, not guessing who they are.
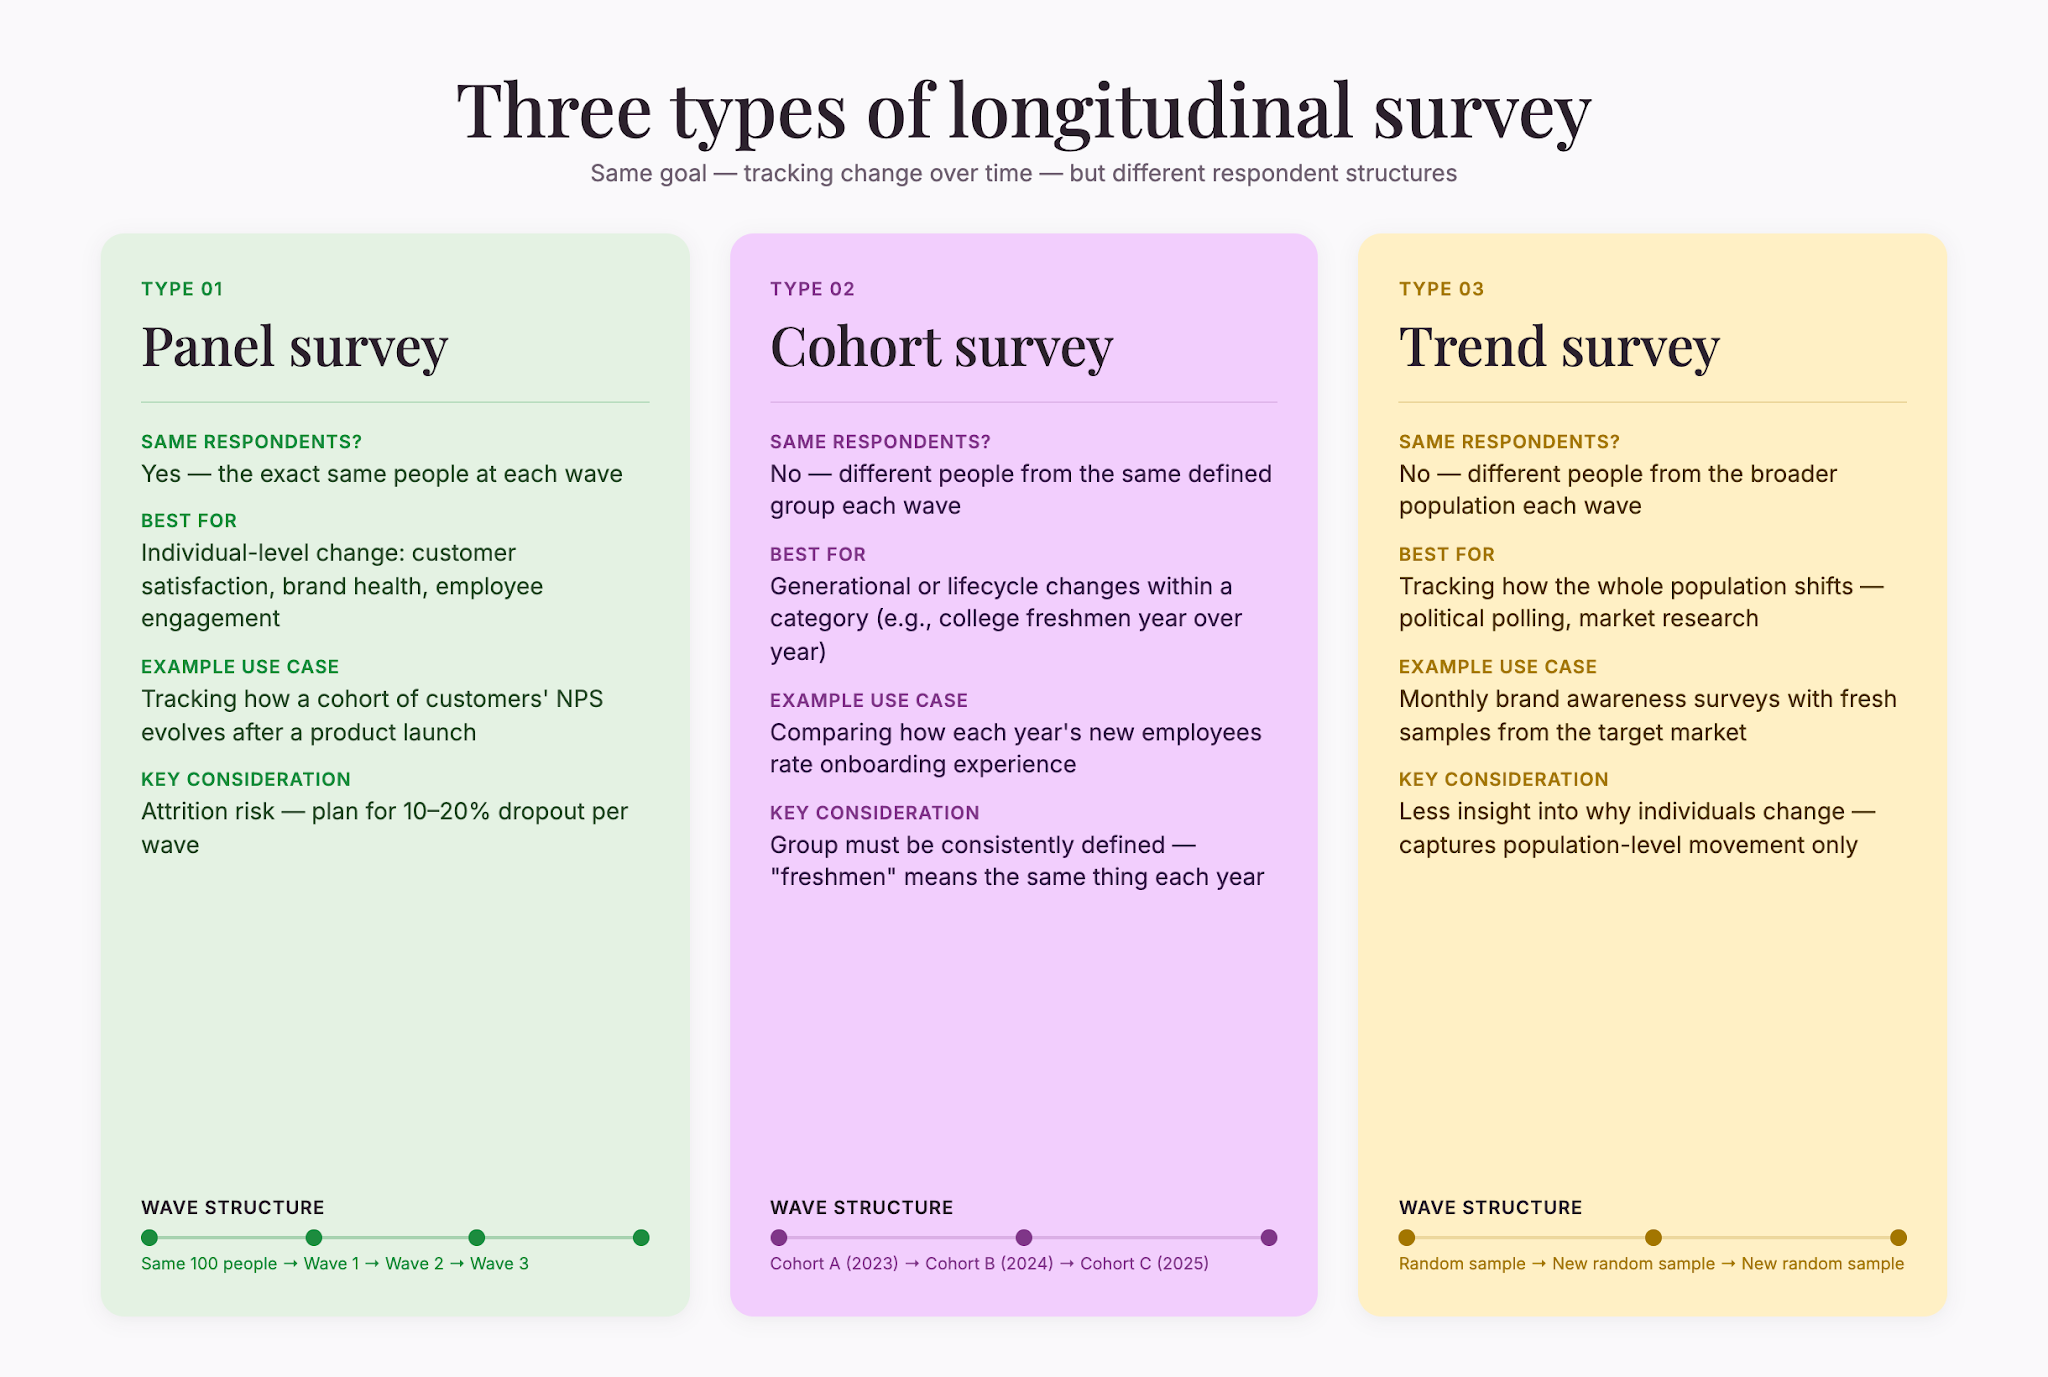
Types of longitudinal surveys
Not all repeated surveys are the same. The structure and timing matter.
Panel surveys
Panel surveys contact the same group of respondents at regular intervals—quarterly, annually, or more frequently. This creates a continuous record of how that specific group evolves.
Panel surveys work best when you care about individual-level change, such as in customer satisfaction tracking, brand health measurement, and employee engagement monitoring.
Cohort surveys
Cohort surveys track different people within a defined group across time waves. You might survey 100 different college freshmen this year, 100 different freshmen next year, and 100 the year after, tracking how the group changes generationally.
Trend surveys
Trend surveys measure the broader population at each wave, with different respondents each time. You’re tracking how the whole population shifts, not individuals.
Trend surveys are less demanding logistically but offer less insight into why change happens at the individual level. They’re often used in political polling and market research.
Designing a longitudinal survey that works
Building an effective longitudinal study requires more planning than a one-off survey. Here’s what matters most.
Define your measurement intervals
How often you contact respondents shapes what you can learn. Monthly contact gives finer granularity but risks survey fatigue. Annual contact captures big shifts but misses in-between movement. Consider your research goal and your audience’s tolerance for repeated contact.
For customer satisfaction or brand tracking, quarterly or biannual contact is common. For employee engagement, annual surveys often suffice.
Keep questions consistent (mostly)
The power of longitudinal data comes from asking the same core questions repeatedly. But don’t be rigid. You can add new questions to explore emerging topics and drop questions that no longer apply. Just be transparent about what changed and why.
Your core metrics should remain identical across waves. Everything else can evolve.
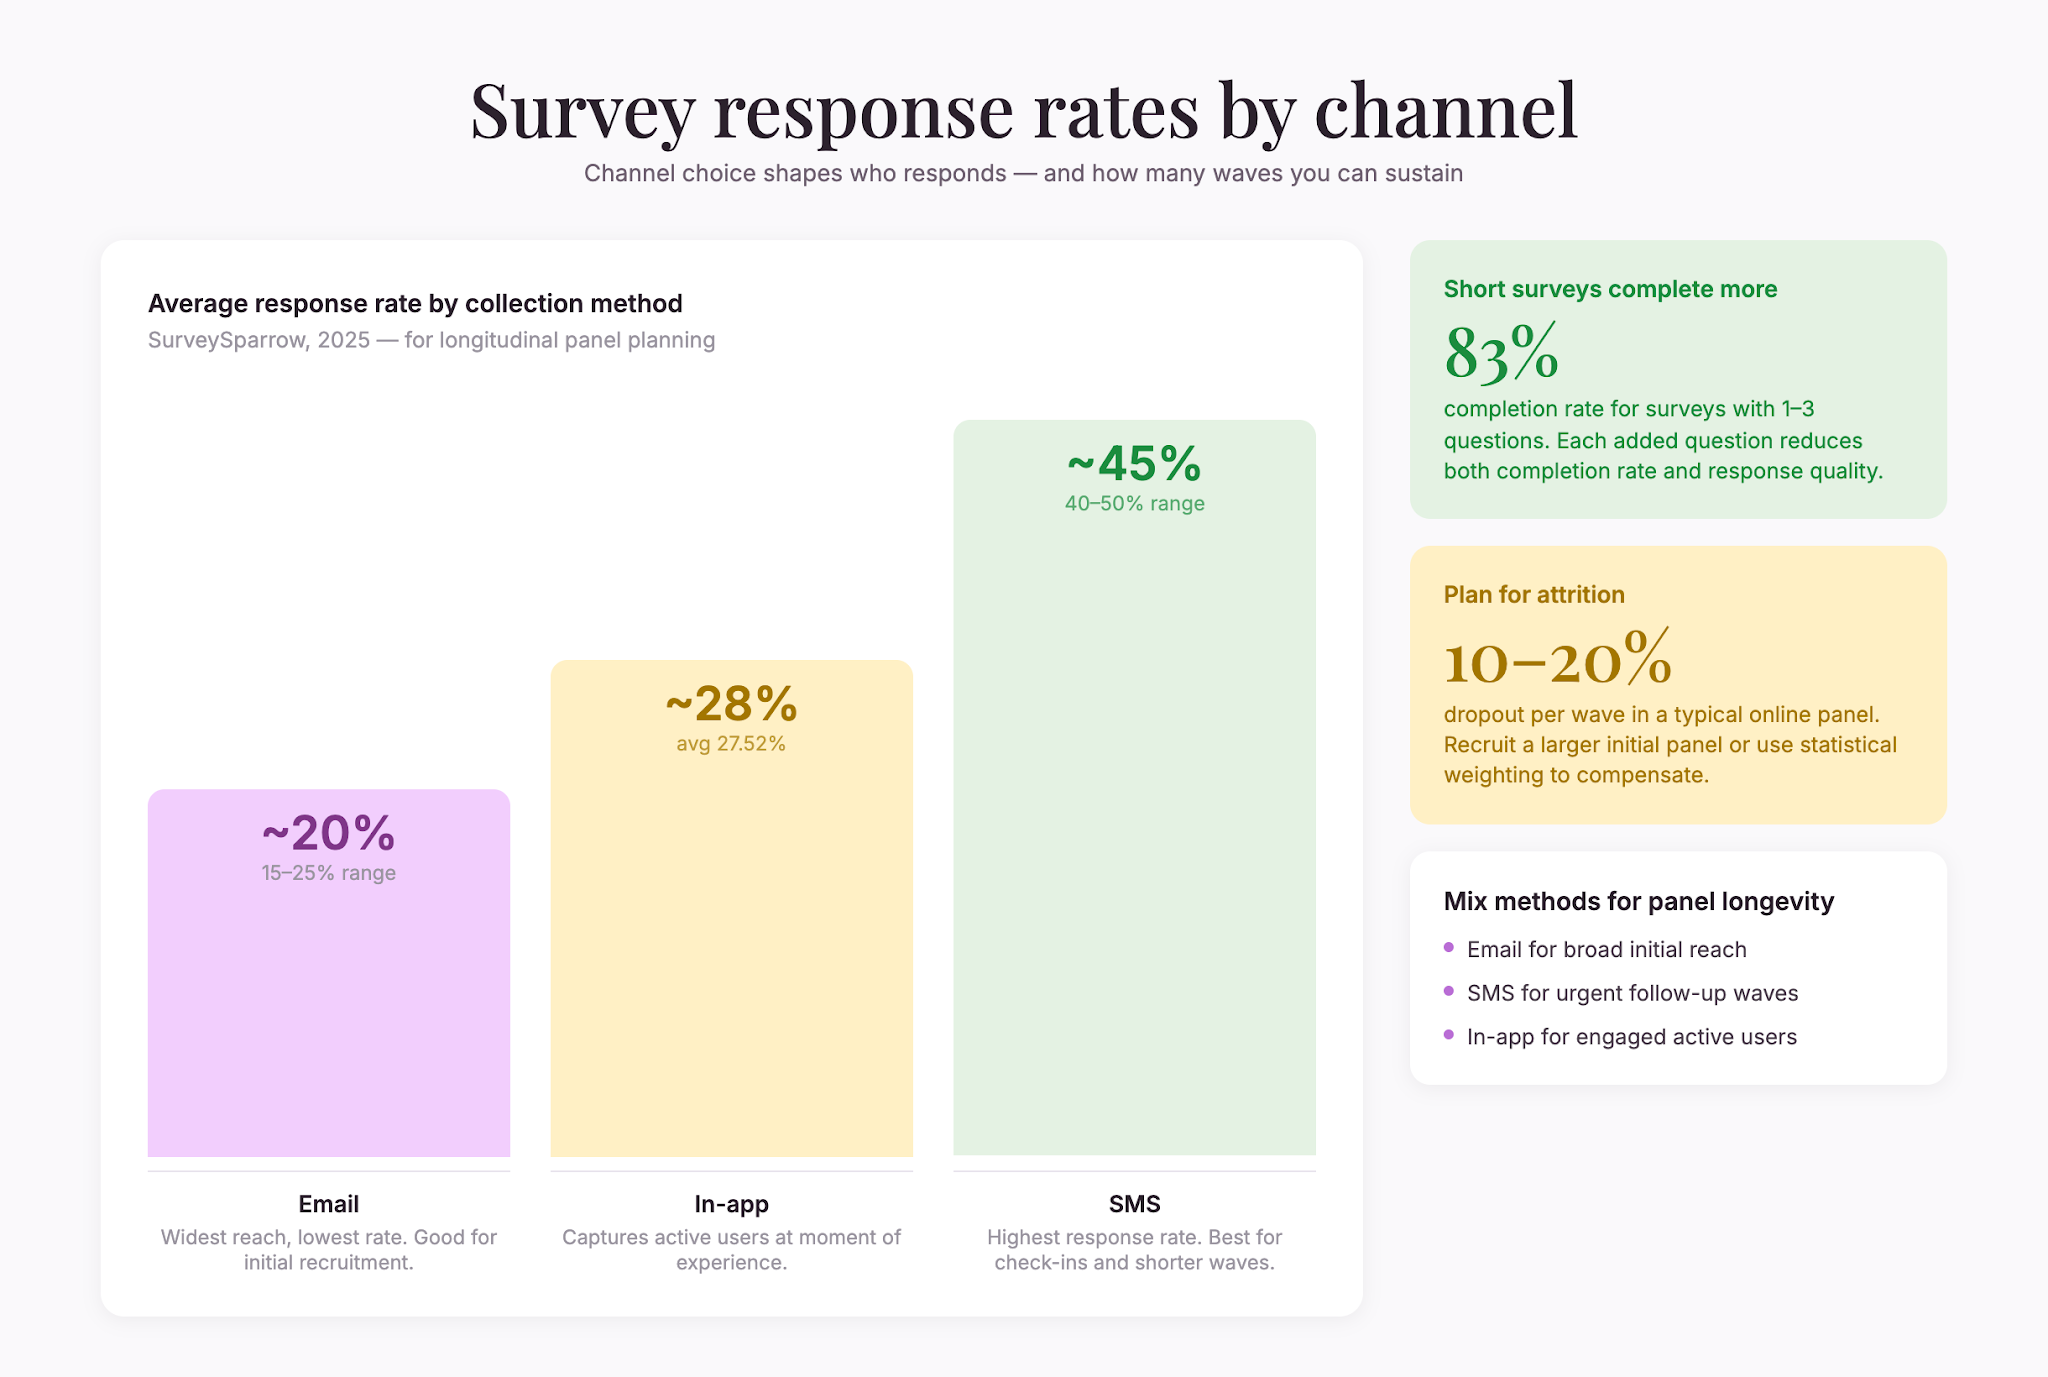
Minimize survey length to protect retention
Respondent attrition is the biggest threat to longitudinal studies. Research shows that short surveys with 1 to 3 questions see completion rates of 83.34% (SurveySparrow Survey Response Rate Benchmarks, 2025), while longer surveys see both lower completion and lower-quality responses as respondents fatigue.
Keep your core questionnaire as lean as possible.
Plan for attrition
People move, change email addresses, lose interest, or get busy. Plan for 10-20% attrition per wave in a typical online panel, more in consumer research, less in captive audiences like employees or students.
Some studies recruit a larger initial panel to account for expected dropout. Others use statistical weighting to adjust for attrition bias.
Choose your contact method carefully
Online surveys remain the dominant data-collection method, with 85% of research professionals using them regularly (Backlinko, 2026). They’re cost-effective, and respondents can complete them on their own schedule. But email surveys typically see response rates of 15-25%, and in-app surveys average 27.52% (SurveySparrow, 2025).
For panel studies needing consistent participation, consider a mix of methods: email for reach, SMS for urgency, in-app for existing users. SMS surveys achieve 40-50% response rates (SurveySparrow, 2025), making them effective for quick check-ins.
Managing bias in repeated surveys
Asking the same people the same questions repeatedly creates unique bias challenges.
Acquiescence bias
Respondents who’ve answered a question before may default to their previous answer or simply agree to move faster. Research across 860,000+ respondents in 20 countries found acquiescence bias ranging from under 3% in Japan, Norway, and Denmark to 13-15% in Israel, India, and China (Latana, 2025).
To combat it, rotate answer options, randomize question order, and periodically rephrase questions to force active engagement.
Habituated response
Respondents may stop reading questions carefully because they’ve seen them before. Vary the phrasing of questions slightly across waves, or occasionally include a “trap” question with a reversed scale to catch inattentive respondents.
Fatigue and break-off
The more times you survey someone, the more likely they are to quit mid-survey or skip questions. Open-ended follow-up questions on the same page as the source question increase survey break-off by 0.6 percentage points and item nonresponse by more than 25 percentage points (Hadler, 2025). Spacing questions across pages and keeping the survey short helps.
Framing effects
The way you present options shapes how people respond. Positive framing (“gain $100”) and negative framing (“avoid losing $100”) push people toward different choices. Be consistent in how you frame options across waves, and note any changes for analysis.
Analyzing longitudinal data
Collecting the data is half the battle. Making sense of it is where many studies falter.
Look for patterns, not single data points
The value of longitudinal data is in the trajectory, not the individual wave. A single respondent’s score moving from 6 to 7 might be noise. But if 60% of your panel shifted from 6 to 7 in the same direction, that’s a trend worth investigating.
Segment by respondent subgroups
The overall population may show stability, but specific segments might be moving fast. Compare trends across customer segments, geographies, or demographics. You might find that younger customers’ sentiment is declining while older customers’ is climbing—opposite trends hidden in aggregate numbers.
Track both changes and consistency
Pay attention to who changed and who didn’t. Do the same people always move first? Understanding the pattern of who changes can be as valuable as understanding what changed.
Use statistical tests appropriately
With repeated measures, use paired statistical tests (like paired t-tests) to assess whether changes between waves are statistically significant or just noise.
Common pitfalls and how to avoid them
Recruiting panelists who aren’t representative
Online panel respondents differ from the general population. They tend to be more engaged, more tech-savvy, and sometimes more opinionated. Be clear about who your panel represents and don’t over-generalize findings.
Losing the thread across many waves
Longitudinal studies that run for years can accumulate changes in questionnaire, personnel, and scope. Document every change, maintain consistent methodology where it matters, and periodically review early waves to ensure alignment with current design.
Ignoring external events
A drop in brand sentiment might coincide with a competitor’s launch, a news story, or a seasonal shift. Note major external events and account for them in analysis. They’re not noise; they’re part of the story.
Assuming stability is success
If your longitudinal survey shows no change, that might be bad news—especially if market conditions or competitive pressure have shifted. Stability can mask missed opportunities.
When longitudinal surveys are worth the effort
Longitudinal surveys require more planning, sustained commitment, and analytical rigor than one-off studies. They’re not always the right tool.
Use longitudinal surveys when:
- You’re tracking a long-term outcome (customer lifetime value, brand health, employee engagement)
- You need to understand how change happens, not just whether it does
- You’re managing an ongoing relationship where understanding evolution matters
- You have the resources to maintain panel recruitment, data quality, and consistent methodology
Skip them when:
- You need a quick, one-time answer
- Your audience is too fragmented or transient to sustain repeated contact
- You’re testing a single hypothesis where a controlled experiment would be clearer
The payoff for longitudinal surveys is clarity—not a frozen moment, but a moving picture of how your audience, market, or organization is changing.

.png)