Quantitative research questions: Examples for cleaner data
Strong quantitative research questions produce cleaner data. See examples of rating, yes-or-no, and multiple-choice formats, plus rules to avoid bias.
Getting meaningful data starts with asking the right questions. Quantitative research questions are designed to gather numbers you can measure, count, and analyze—whether that’s yes-or-no answers, rating scales, or multiple-choice responses. They’re the foundation of solid research.
But here’s the thing: weak questions lead to weak data. And weak data leads to weak decisions. Only about 30% of data in organizations is considered high-quality and reliable (DataStackHub, 2025), which means most teams are working with information they can’t fully trust.
The good news? Crafting strong quantitative research questions is a learnable skill. When you know what you’re asking and why, you get cleaner responses, easier analysis, and insights you can actually act on.
What makes a quantitative research question
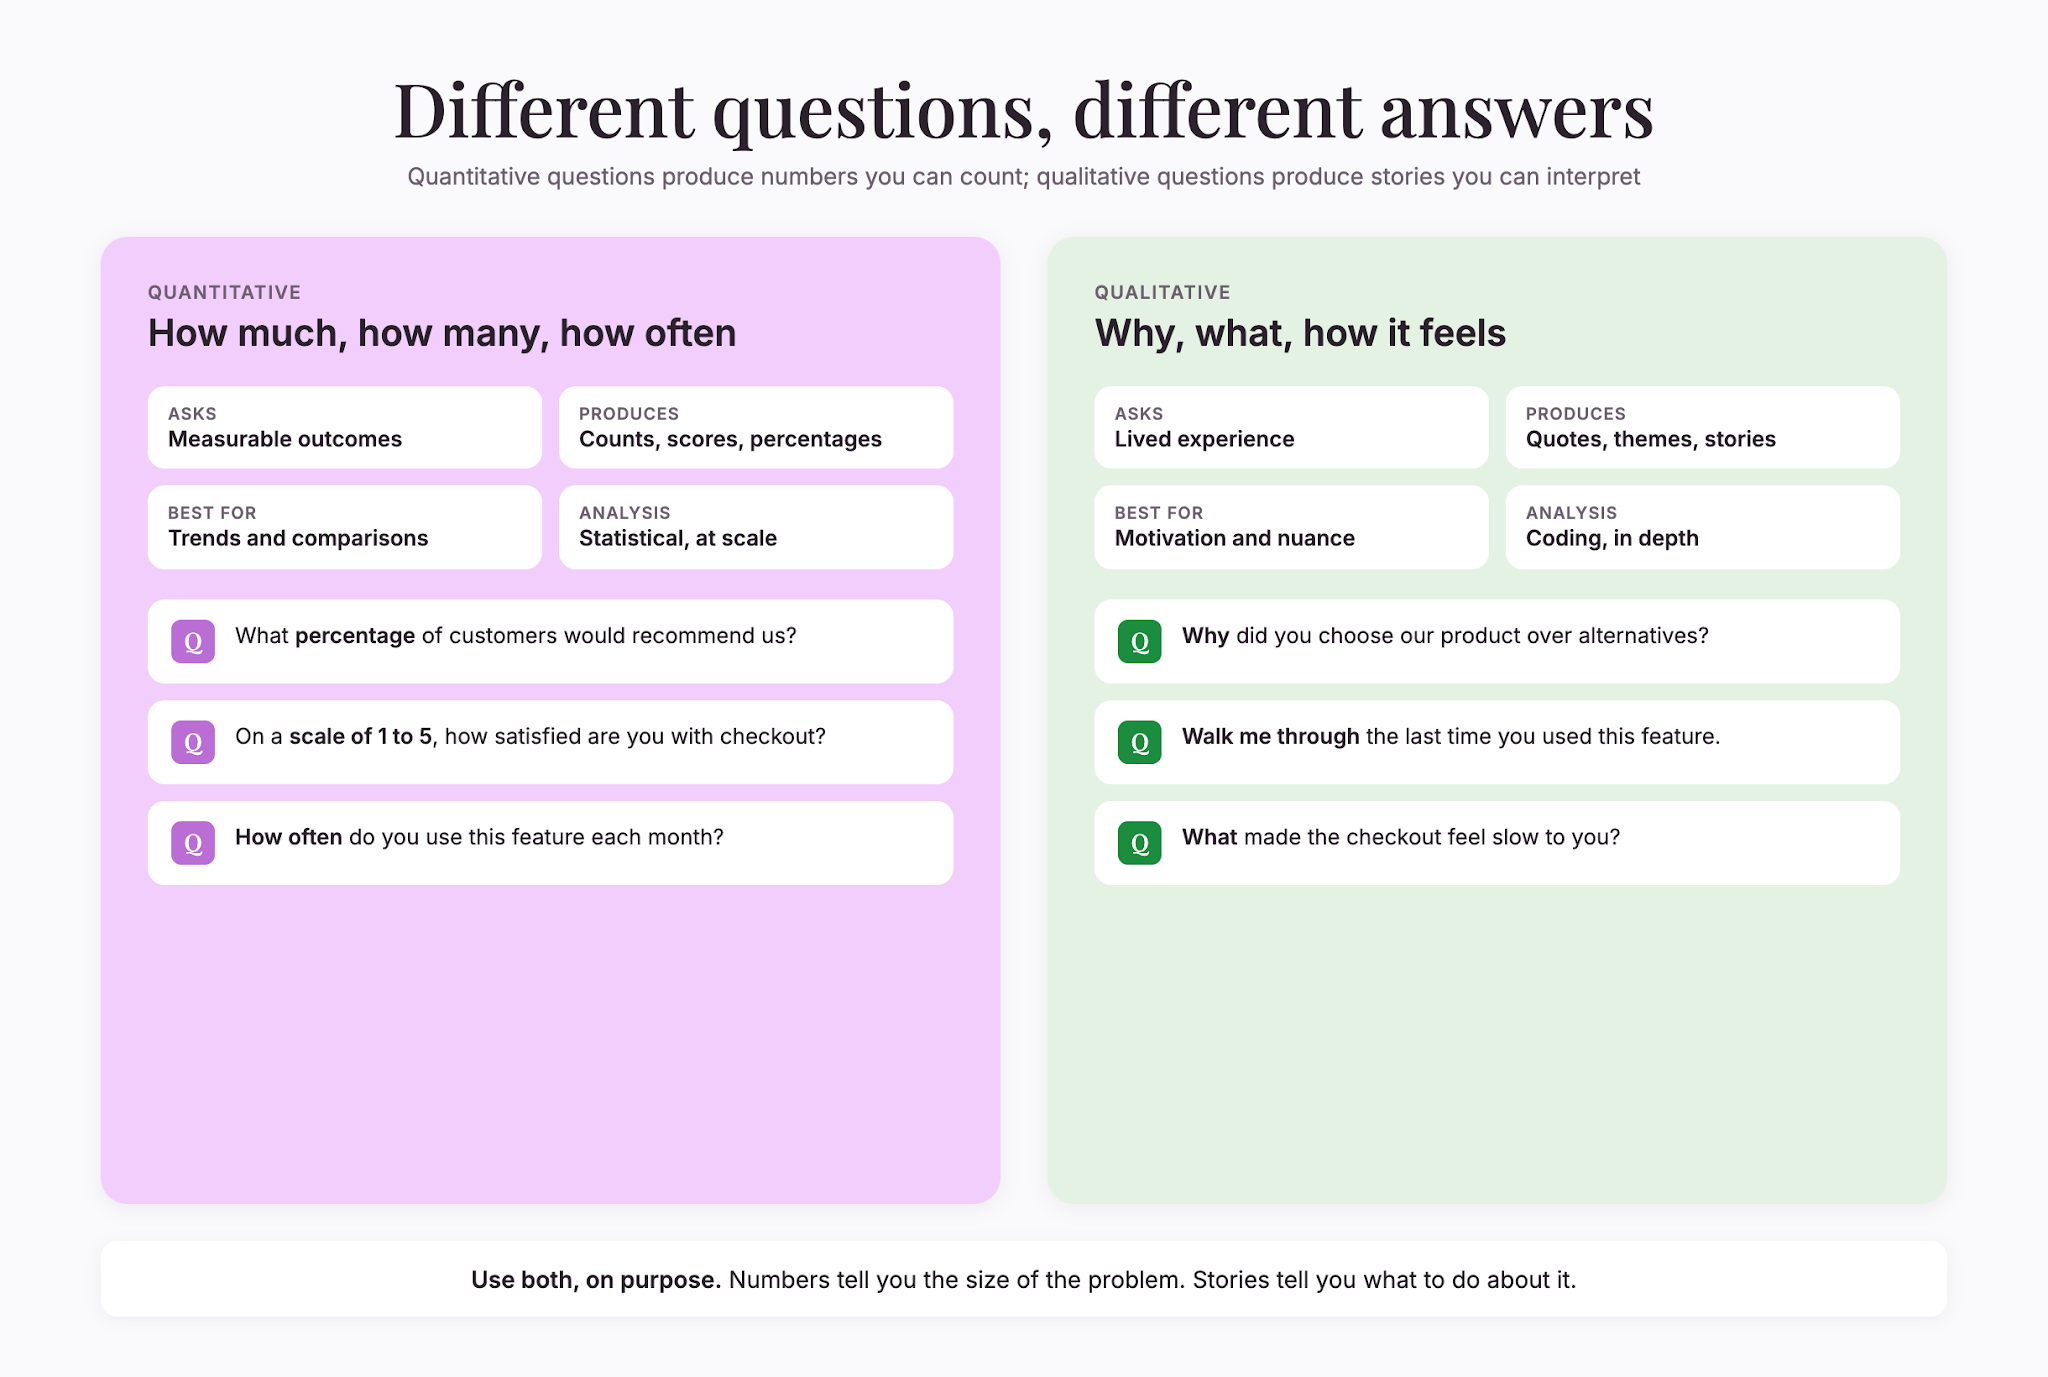
Quantitative research questions are fundamentally different from qualitative ones. They’re built to produce numerical answers—data you can count, graph, and compare.
A quantitative research question asks “how much,” “how many,” or “how often.” It focuses on measurable outcomes and population-level patterns rather than individual experiences or interpretations. Think: “What percentage of customers would recommend us?” or “How many employees use the wellness program each month?”
These questions work because they’re specific, testable, and designed to be answered with data rather than stories. They create a clear framework for respondents to provide consistent, analyzable information that doesn’t rely on interpretation or subjective judgment.
Why quantitative research questions matter for data quality
There’s a direct line between the questions you ask and the quality of data you get back.
Poor questions lead to confusion. Respondents misinterpret what you’re asking, answer differently than intended, or abandon the survey altogether. Strong questions do the opposite. They’re clear, unambiguous, and easy to answer.
The stakes here are real. About 61% of organizations report data inconsistency issues that actually impact decision-making (DataStackHub, 2025). Many of these problems trace back to how questions were framed in the first place.
When your quantitative research questions are well-constructed, you reduce noise in your data. You make analysis faster. You increase the likelihood that what you measure is what you meant to measure. That’s why taking time upfront to craft solid questions saves time and money downstream. The investment in question design pays dividends throughout your entire research process and beyond.
Common types of quantitative research questions
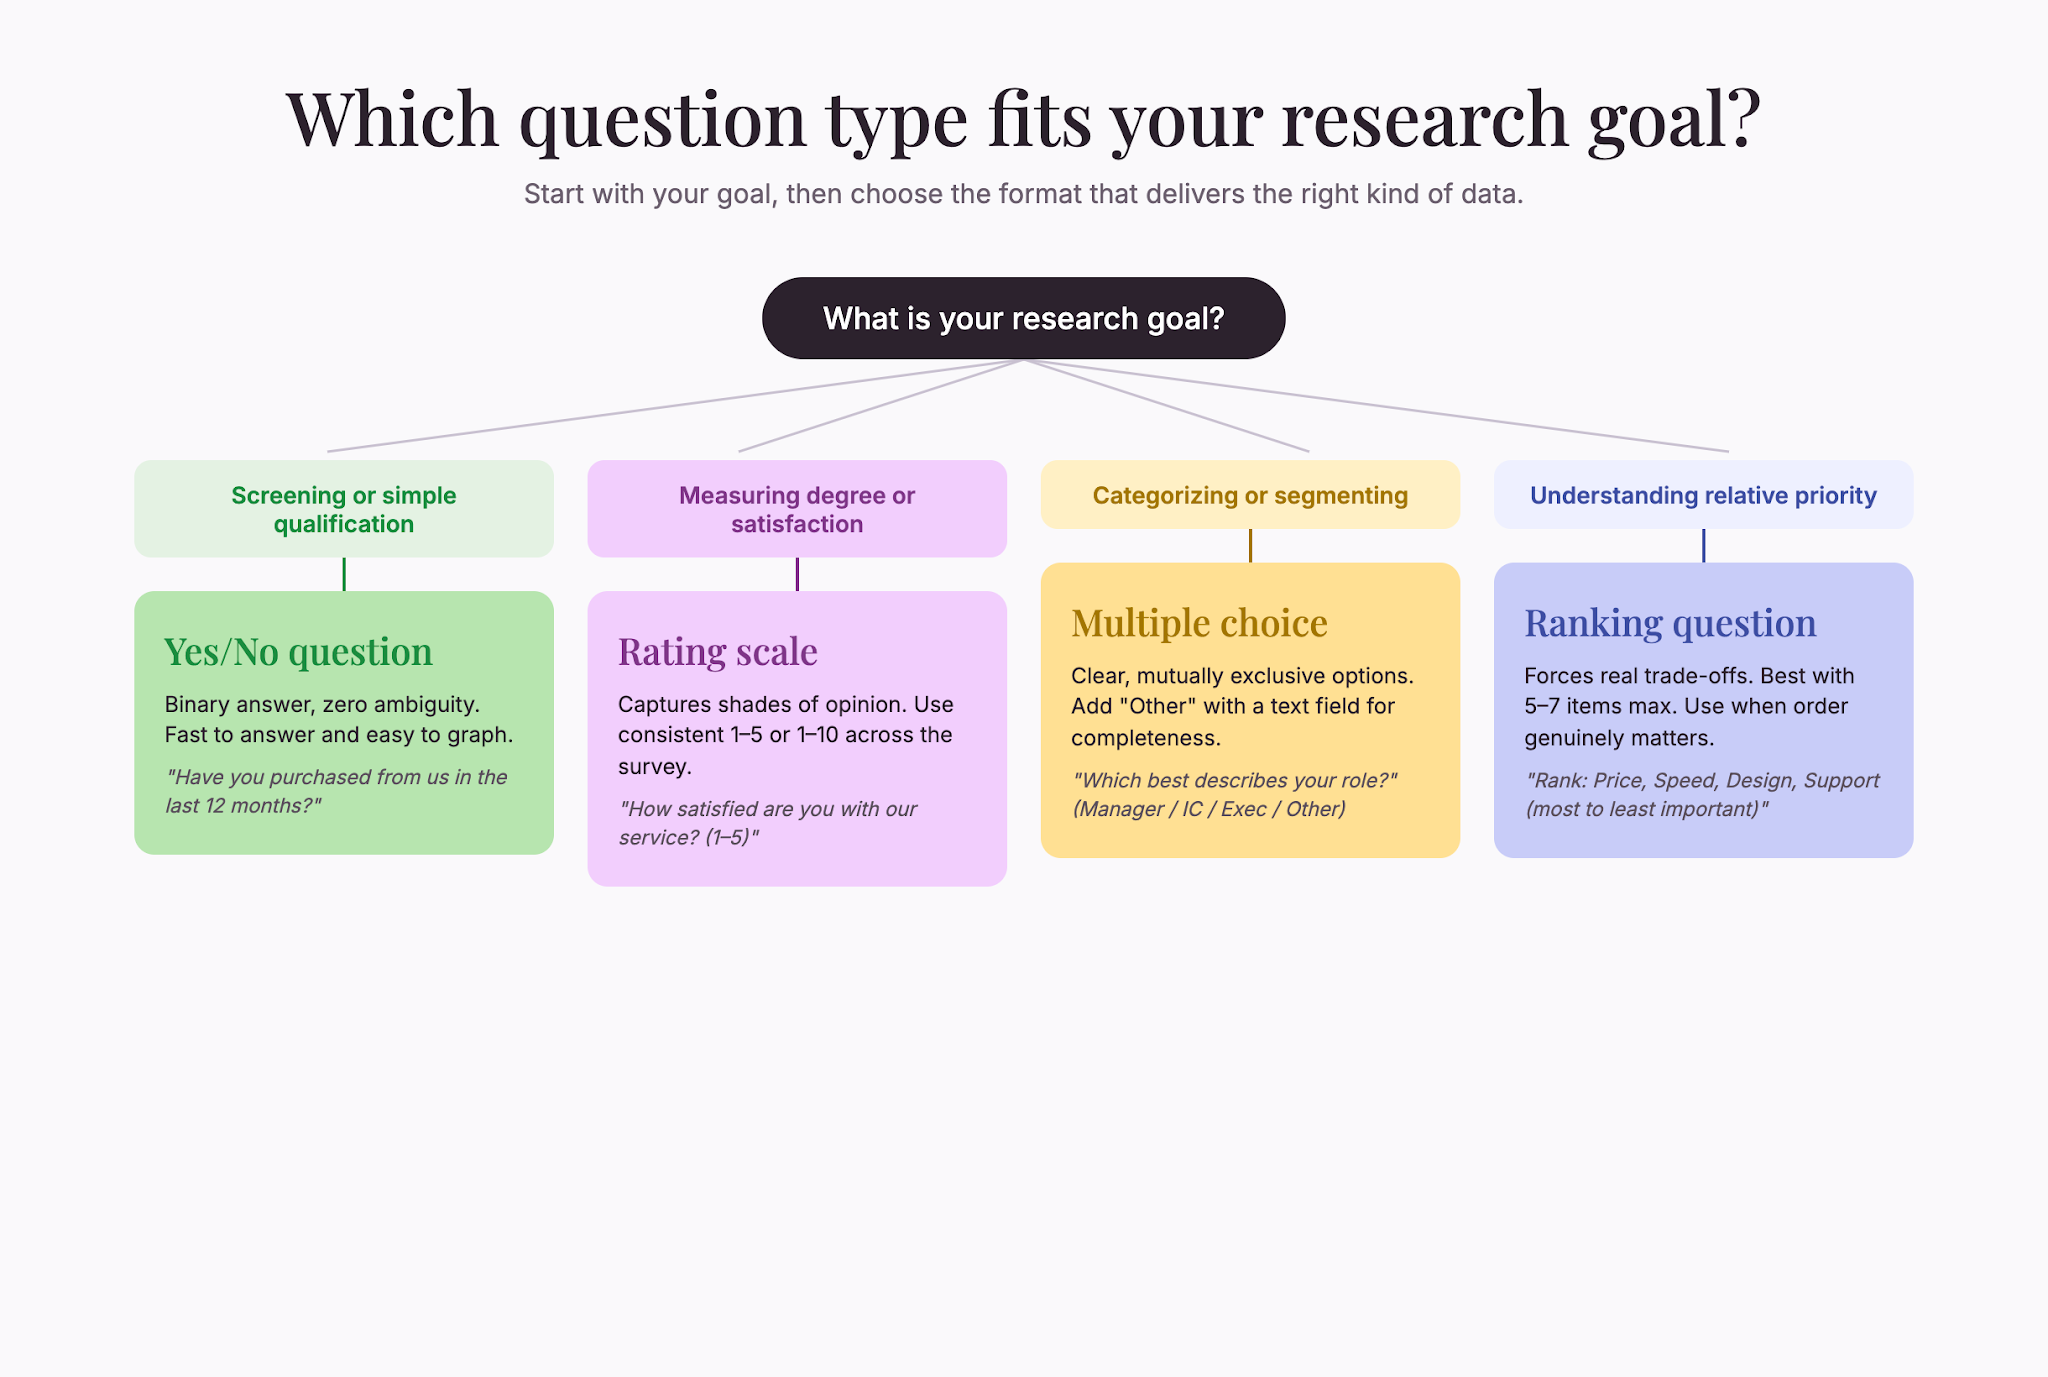
Yes-or-no questions
Yes-or-no questions—also called dichotomous questions—are the simplest form of quantitative research. A dichotomous question is a close-ended question with exactly two answer options. The most common pairing is yes and no, though agree-disagree, true-false, and satisfied-unsatisfied are widely used (SurveySparrow, 2024).
These questions are fast to answer, reduce respondent fatigue and dropout, produce categorical data that is easy to quantify and graph without complex stats software, and are well-suited to screening and quick assessments (piHappiness, 2024).
The downside? They’re binary. They don’t capture nuance. “Do you like our product?” gives you a binary answer, but it doesn’t tell you why someone feels that way or what specifically they like or dislike.
Example: “Have you purchased from our company in the last 12 months?”
Rating scale questions
Rating scales ask respondents to place their answer on a spectrum. Common formats include 1–5 or 1–10 scales, where one end means “not at all” and the other means “very much.”
These questions work well because they capture degrees of opinion or experience. They’re richer than yes-or-no questions and still simple enough for most respondents to answer quickly.
The trick is consistency. If you’re using Likert scales—a question type that measures attitudes and opinions—make sure you use the same point system across your survey. If one question uses 1–5 and another uses 1–10, you create confusion and dirty data.
Example: “On a scale of 1 to 5, how satisfied are you with our customer service?”
Multiple-choice questions
Multiple-choice questions give respondents several preset options to choose from. They’re quick to answer and produce data that’s easy to categorize and count.
The key is making sure all options are clear, mutually exclusive, and exhaustive. If “other” is an option, provide a text field so respondents can explain what they mean. That extra detail often becomes valuable data.
Example: “Which of the following best describes your role?” (with options like Manager, Individual Contributor, Executive, Other)
Ranking questions
Ranking questions ask respondents to order items in priority, preference, or importance. “Rank these features from most to least important” is a ranking question.
These are useful when you want to understand relative preference, but they’re harder to analyze than simple multiple-choice. Use them when the relative order genuinely matters to your research.
Example: “Rank these product features in order of importance to you: Price, Speed, Design, Customer support.”
How to write quantitative research questions that work
Be specific and measurable
Vague questions produce vague data. For instance, “Are you happy with your experience?” is too broad.
Here’s the better option: “On a scale of 1 to 5, how would you rate the speed of our checkout process?”
The second version tells you exactly what’s being measured, making the data actionable. You can track it over time, compare it across customer segments, and know what to improve.
Use clear, plain language
Avoid jargon, complex vocabulary, and corporate speak. Pretend you’re talking to someone who’s never heard your internal terminology before—because your respondents probably haven’t.
Bad: “To what extent do you perceive the efficacy of our service delivery mechanisms?”
Better: “How effective is our customer service?”
Avoid double-barreled questions
A double-barreled question asks about two things at once, making it impossible to know which part respondents are answering.
Bad: “How satisfied are you with the quality and price of our product?”
Better: Ask them separately. “How satisfied are you with the quality of our product?” and “How satisfied are you with the price of our product?”
Watch out for leading questions
A leading question pushes respondents toward a particular answer. It biases the data before they even respond.
Bad: “Don’t you agree that our product is the best on the market?”
Better: “How would you compare our product to others you’ve considered?”
Account for response biases
Common survey biases include acquiescence bias—the tendency to agree with statements regardless of content—and social desirability bias, where respondents overreport good behavior and underreport bad behavior when facing sensitive questions (Qualtrics, 2025).
To minimize these biases:
- Offer neutral or middle options in rating scales so people don’t feel forced to agree or disagree
- Make it easy to give honest answers by removing judgment from question wording
- For sensitive topics, consider anonymous response options
- Test your questions with a small group first to see if wording triggers bias
Avoid absolute language
Words like “always,” “never,” and “all” force respondents into extremes that don’t match reality. Most behaviors and opinions exist on a spectrum.
Bad: “Do you always follow our product tutorials?”
Better: “How often do you follow our product tutorials?” (with options like Never, Rarely, Sometimes, Often, Always)
Building a strong quantitative research survey
Once you’ve crafted individual questions, think about how they fit together.
Online surveys rank as the most used quantitative method among market research professionals, with 85% using them regularly (Backlinko, 2026). If you’re building an online survey, consider these principles:
- Order matters. Put easy, engaging questions first to build momentum. Save sensitive or complex questions for later, when respondents are invested
- Group related questions. If you’re asking about product features, ask them all together so respondents stay in the same mindset
- Keep it short. Longer surveys have higher dropout rates. Aim for the shortest survey that still answers your core research questions
- Test before launch. Preview your survey on desktop and mobile. Take it yourself. Ask colleagues to take it and point out confusing questions
How data quality and quantitative questions connect
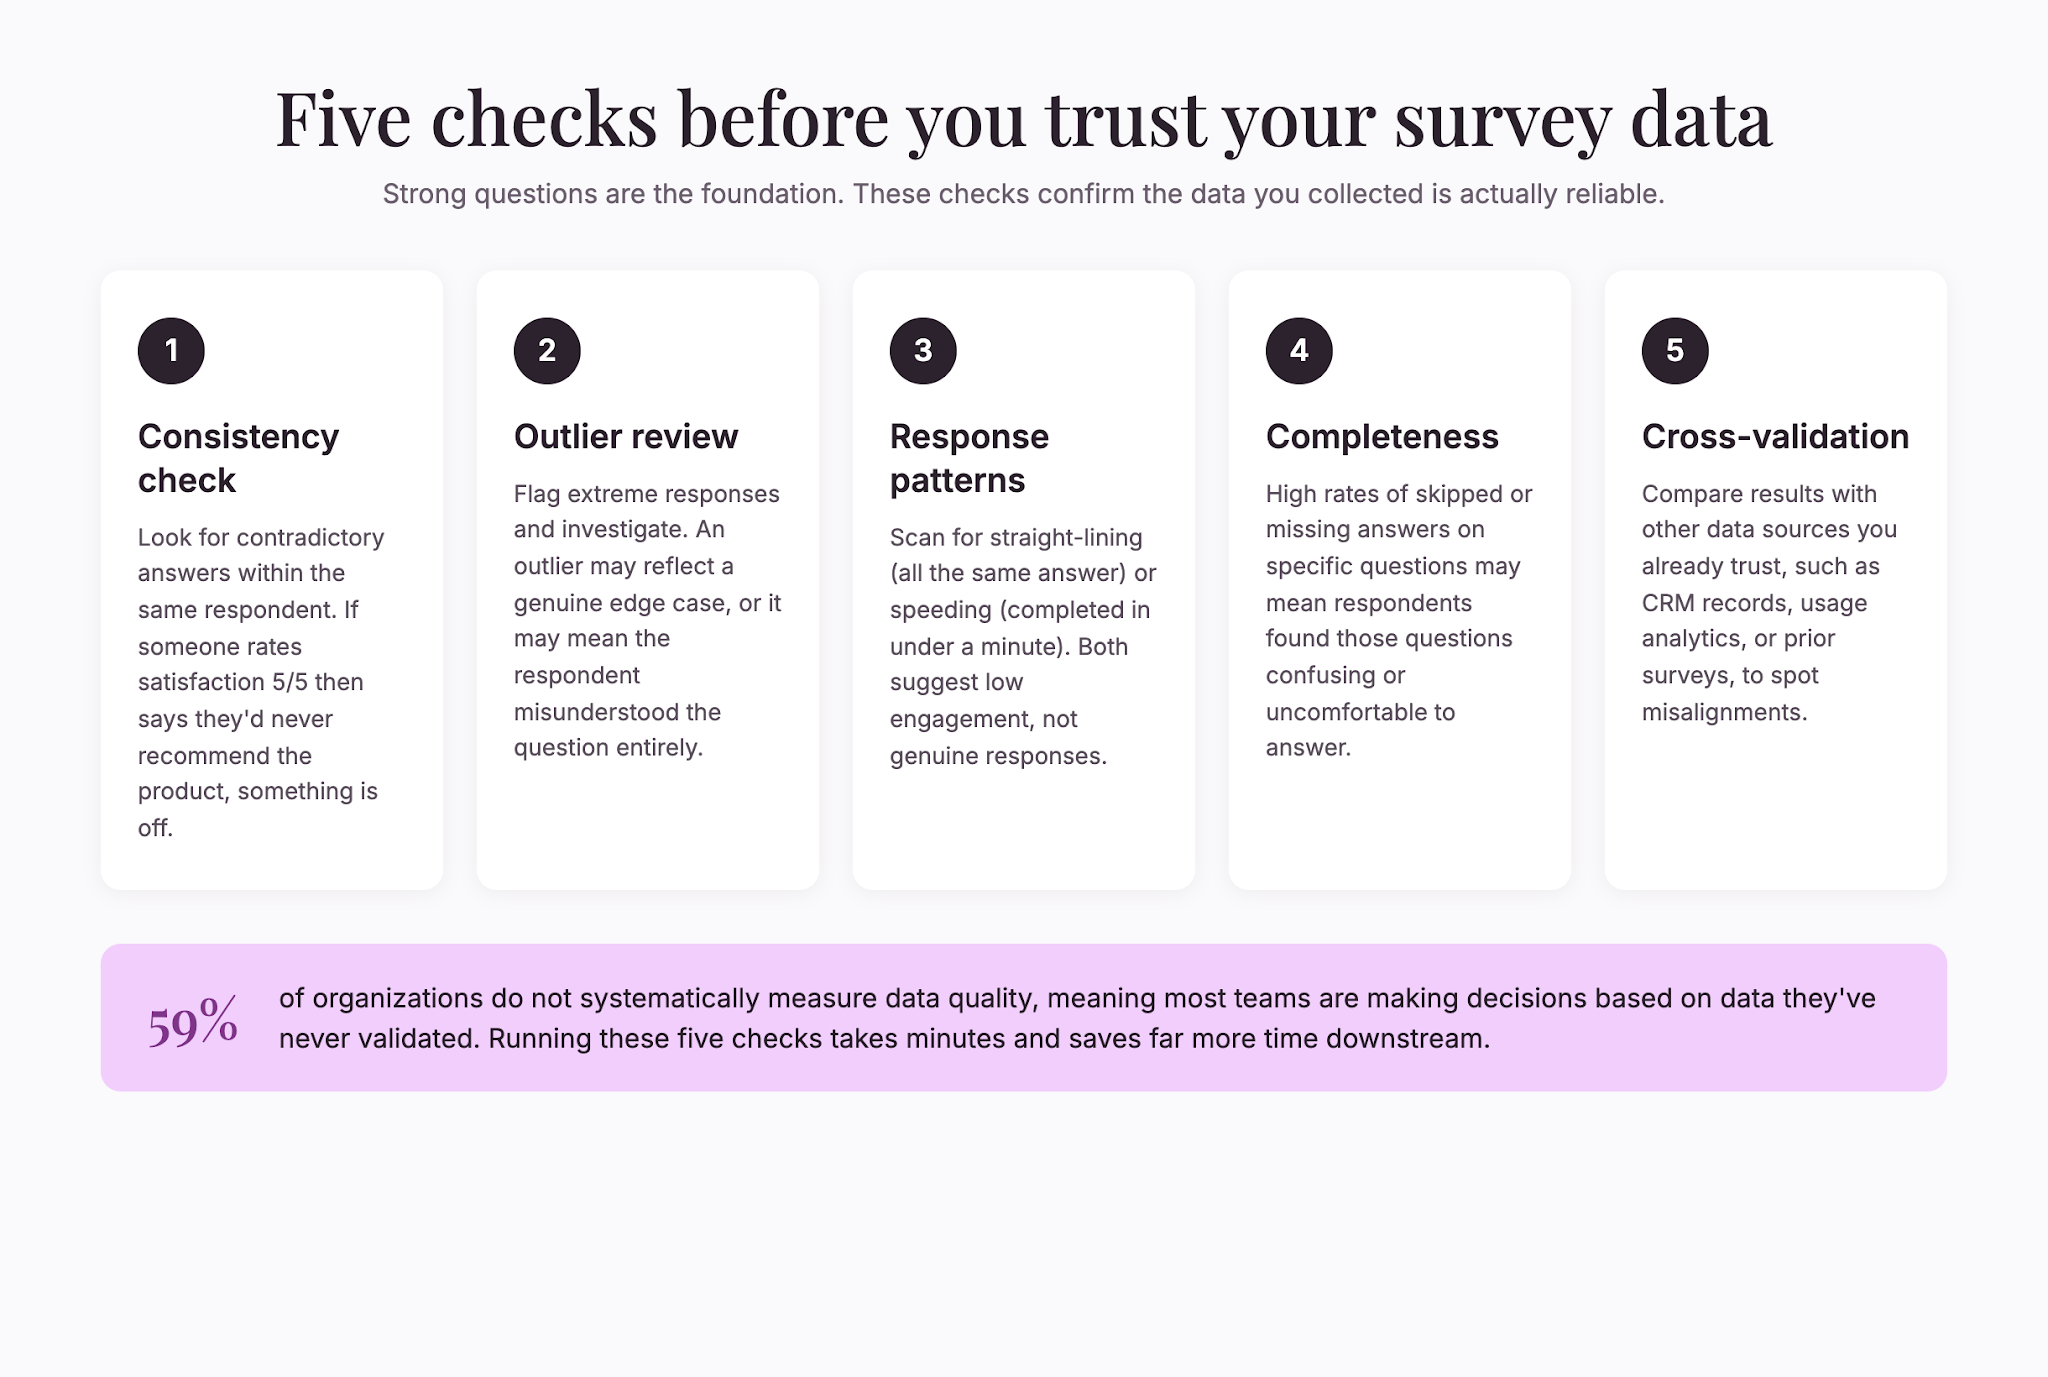
The connection between question quality and data quality is direct and measurable. Organizations with a formal data governance program—which includes clear standards for how data is collected—report better data quality (DataStackHub, 2025). Yet 59% of organizations still do not systematically measure data quality (Bi Technology, 2025).
This means most teams aren’t even checking whether their quantitative research is producing reliable information. They ask questions, get answers, and move forward without validating that the data makes sense.
Before you launch any survey or research project, decide how you’ll measure quality:
- Are responses internally consistent?
- Do outliers make sense, or do they suggest respondents misunderstood the question?
- Are there patterns of missing data that suggest certain questions were confusing?
- Do results align with other data sources you trust?
[GRAPHIC: Infographic showing a five-step data quality checklist: 1) Consistency checks, 2) Outlier review, 3) Response patterns, 4) Completeness metrics, 5) Cross-validation with other sources]
data-quality-checklist
Quantitative research questions in practice
Here are realistic examples across different contexts:
Customer satisfaction research
- “How likely are you to recommend us to a friend or colleague on a scale of 0 to 10?”
- “Which of the following best describes why you chose our product?” (with preset options)
Product development feedback
- “How often do you use this feature?” (Never, Rarely, Sometimes, Often, Always)
- “Rank these potential improvements by importance to you”
Employee engagement surveys
- “To what extent do you agree: I have the tools I need to do my job well” (Strongly Disagree to Strongly Agree)
- “How many times per month do you use our internal communication platform?”
Market research
- “What is your primary job title?”
- “In the past year, have you purchased products in this category?”
Academic research
- “On a scale of 1 to 5, how confident do you feel in your understanding of this concept?”
- “How many hours per week do you spend on coursework?”
The best quantitative research questions are ones that serve your actual research goal—not questions that sound official or questions you’ve always asked before. By aligning your questions with specific objectives, you ensure every response contributes meaningful information to your analysis.
The takeaway
Quantitative research questions are your tool for turning opinions and behaviors into data you can act on. The stronger your questions, the cleaner your data. And clean data is what leads to confident decisions.
Spend time upfront crafting clear, specific, unbiased questions. Test them before going live. Watch for response patterns that suggest confusion. And remember, the goal isn’t to ask the most questions—it’s to ask the right questions.
When you get quantitative research right, you stop working with data you merely hope is accurate. You start working with data you know you can trust.

.png)