Product-Market Fit Survey: The Sean Ellis Test, Reimagined
Learn more about the Sean Ellis test and product market fit surveys. See why using a single question has guided startups for more than a decade.

Key takeaways
- One question measures dependence, not delight: The Sean Ellis test asks how users would feel if your product disappeared, because imagined loss reveals need where satisfaction questions invite polite shrugs.
- 40% is the line that matters: Startups where at least 40% of active users would be "very disappointed" to lose the product almost always show strong traction, while those below it struggle to grow.
- Segments beat the score: Splitting respondents into very, somewhat, and not disappointed groups turns a pass-fail number into a nuanced picture. Devoted users define your market, whereas fence-sitters direct your next sprint.
- Run it as a quarterly loop: Re-surveying fresh users each quarter shows whether your roadmap is converting lukewarm users into people who'd genuinely miss you.
Most teams discover they've lost product-market fit the way they discover a flat tire: suddenly, and at the worst possible moment. Growth stalls, churn creeps up, and nobody can point to the week things went wrong. A product-market fit survey gives you an earlier warning system. It tells you how much your users would miss you before the metrics tell you they've already left.
The best-known version is the Sean Ellis test, a single question that has guided startups for over a decade. This article explains how the test works, why it measures the right thing, and how to reimagine it, turning a one-off score into a repeatable engine for finding and deepening fit.
What the Sean Ellis test actually measures
Sean Ellis, the growth practitioner who coined the term "growth hacking," wanted a fast way to tell whether a startup was ready for acquisition. Traditional satisfaction questions didn't cut it. People will say they're satisfied with products they'd abandon tomorrow without a second thought.
So Ellis flipped the framing. Instead of asking people how much they like your product, he asked how they'd feel without it:
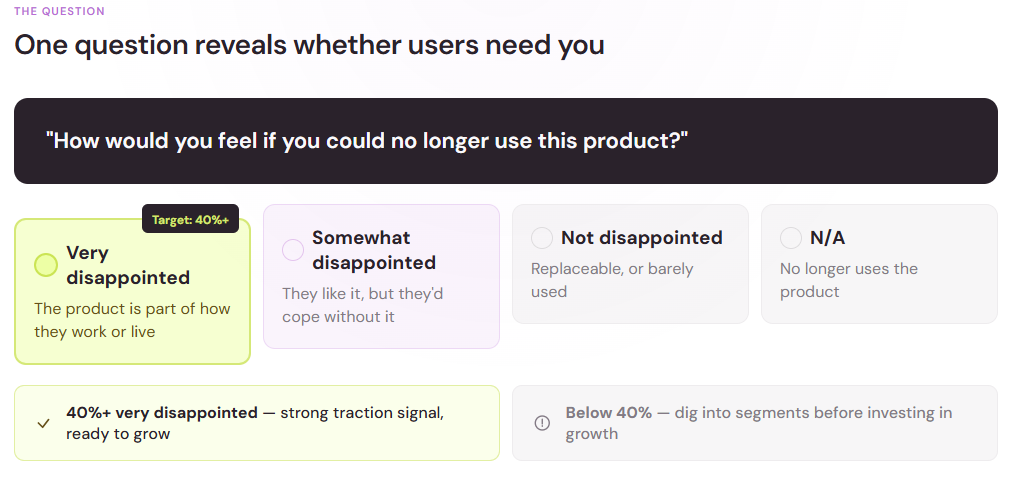
"How would you feel if you could no longer use this product?"
Respondents pick one of four answers:
- Very disappointed – the product has become part of how they work or live
- Somewhat disappointed – they like it, but they'd cope without it
- Not disappointed – it's replaceable, or barely used
- N/A – they no longer use the product
Ellis arrived at his threshold by benchmarking the survey across nearly a hundred startups: companies where at least 40% of users answered "very disappointed" almost always had strong traction, while companies that struggled to grow almost always fell short of that mark.
Why disappointment beats delight
That single question is the backbone of most product-market fit surveys worth running. The phrasing does something clever that satisfaction questions can't: it asks people to imagine loss.
The question works because imagined loss cuts deeper than mild approval. Losing something stings more than never having it. Asking "how satisfied are you?" invites a shrug and a thumbs-up or down. Asking "how would you feel if this disappeared?" forces respondents to picture waking up tomorrow without the product. The answer reveals dependence, not mere approval.
Dependence is the thing you really want to measure. Satisfied users churn all the time. Dependent users reorganize their life around you, complain loudly when you ship a bad update, and drag their friends or colleagues into using the product. A survey built around disappointment finds those people and tells you how many of them you have.
How to run the test well
The question itself takes 10 seconds to write. The signal quality depends on everything around it: who you ask, when you ask, and what you ask after. The fundamentals of designing a market research survey apply here just as much as they do to any other study.
Survey the right users
Don't blast the question to your whole list. Someone who signed up yesterday can't tell you whether the product is indispensable since they haven't lived with it yet. A common approach is to filter for people who have experienced the core of the product recently: they've used it more than once, and used it within the last few weeks.
Spend real thought on choosing the right people to survey. If you only hear from your loudest fans, your score will flatter you. If you include people who downloaded (but never opened) your app, for example, it will unfairly punish you. Neither number helps you decide anything.
Sample size matters less than sample honesty at this stage. A modest batch of thoughtful answers from active users beats a mountain of replies from people who barely remember signing up. If your user base is small, survey in rolling waves as new users cross the “active” threshold, and let the picture build over time rather than waiting for a census.
Ask at a natural moment
Timing impacts honesty. Catch users inside the product or shortly after they've completed a meaningful action, and their answer reflects real experience rather than a vague memory. Email works too, but expect fewer responses and a skew toward people with strong feelings in either direction.
Avoid surveying right after a pricing change, an outage, or a big launch. Any of those events colors the answers, and you won't know whether you're measuring the product or the news cycle. Pick an ordinary week, and keep the moment consistent between rounds so your readings are comparable.
Add follow-up questions (sparingly)
The score alone is a signal. The follow-ups tell you how to interpret it. These are the three most relevant next questions:
- What type of person do you think would benefit most from this product?
- What is the main benefit you get from it?
- How can we improve the product for you?
Keep the whole thing under five questions. Every additional field risks more drop-offs, and a product-market fit survey with a tiny, biased sample is worse than no survey at all. If you'd rather not build the questionnaire from scratch, starting from a product research template gets the structure right and leaves you to focus on wording.
Reimagining the test: from scoreboard to engine
Here's where the classic test gets an upgrade. Treating the 40% line as a pass-fail exam misses most of its value. The reimagined version treats the survey as a loop you run every quarter, and the segments—not the score—become the point.
Segment before you interpret
Split your respondents into three groups: very disappointed, somewhat disappointed, and not disappointed. Each group answers a different strategic question for you.

The very disappointed group defines your real market. Read their answers to "what type of person benefits most?" and you'll often find a sharper description of your ideal user than anything in your positioning documents. These users tell you who to find more of.
The somewhat disappointed group is your growth reserve. Some of them are one fixed frustration away from becoming devoted users. Their answers to "how can we improve?" are your highest-leverage roadmap input, but only where their requests align with what the very disappointed group already loves. Chasing every request from lukewarm users dilutes the product.
The not disappointed group is a trap. Building for them pulls you away from your core. Note their feedback, then politely set it aside.
Recompute the score for your true audience
Once the very disappointed group has described who benefits most, you can filter your results to only the respondents who match that profile. Your fit score among the people you're actually built for is a sharper, more decision-ready number than a blended average across everyone who wandered in. One well-known email startup rebuilt its entire growth funnel around this approach, using automated surveys to qualify prospects and focus the team on users who matched its ideal profile.
Track the trend, not the snapshot
A single reading tells you where you stand. A quarterly series tells you whether your roadmap is working. Ship changes aimed at converting the somewhat disappointed group, re-run the survey with fresh users, and watch whether the very disappointed share climbs. That feedback loop—measure, build, measure again—is the reimagined test's real payoff.
How it compares to NPS and CSAT
Teams sometimes assume their existing metrics already cover this ground. They don't. Each of these survey metrics answers a different question.
Net Promoter Score (NPS) asks how likely someone is to recommend you on a 0-10 scale. It measures advocacy—a social act—rather than dependence. Benchmarks vary so widely by sector that a score signaling health in one industry can signal trouble in another, which is why NPS is best read against direct competitors rather than a universal bar.
Customer satisfaction (CSAT) measures contentment with a recent experience. In the United States, the national American Customer Satisfaction Index sits at 76.7 on a 100-point scale, a figure that has barely moved since 2013 despite heavy customer-experience spending. CSAT is a fine operational pulse check, but satisfaction is exactly the polite, low-stakes sentiment the Sean Ellis test was designed to bypass.
The disappointment question completes the set. CSAT tells you whether the last interaction went well. NPS tells you whether users will vouch for you. The fit score tells you whether they need you. Early-stage teams should weigh the third question most heavily, because retention and word of mouth both flow from dependence.

Analyzing the answers without drowning
The multiple-choice score takes minutes to tally. The open-ended follow-ups are where teams stall, because a few hundred free-text answers are slow to process manually.
Work through them with a simple coding pass. Read a sample of responses, define recurring themes—speed, price, a specific feature, a specific frustration—then tag every answer against those themes. Count the tags by segment, and patterns surface quickly: the benefit your devoted users mention most is your marketing message; the frustration your lukewarm users mention most is your next upgrade.
Suppose your very disappointed users keep describing the main benefit as "I stopped losing track of client requests," while your somewhat disappointed users keep asking for a faster mobile app. You now have a headline and a sprint plan in the same afternoon, plus a clear reason to deprioritize the feature ideas coming from users who wouldn't miss you anyway.
Automation can shoulder much of this. Around 47% of researchers worldwide already use AI regularly in their market research work, and theme extraction from open-text survey responses is one of the tasks it handles best. Let software do the first clustering pass, then apply human judgment to decide what the clusters mean. Keep reading some of the raw samples yourself, though; verbatim quotes carry nuance and emotion that no summary preserves, and they're persuasive artifacts when you're arguing for a roadmap change.
Make it a habit, not an event
The Sean Ellis test earned its place by compressing a hard question—do people need this?—into one line. The reimagined version earns its keep by refusing to stop at the number. Segment the respondents, let your devoted users define the market, let your fence-sitters dictate product improvements, and re-run the loop every quarter.
Start this week: pick your recently active users, ask the disappointment question plus three follow-ups, and block an afternoon to read the answers. Whatever your score, you'll come away knowing exactly who you're for and what to build next.

Liked that? Check these out:

Opinions and Expertise
What’s actually slowing research teams down (Hint: it’s not the research)
From recruiting participants and scheduling interviews to building the actual surveys, the operational drag is taking researchers away from what they do best. See what's actually slowing them down and how Research Flow fixes it.
Read more