Survey response bias: What it is and how to avoid it
A guide to survey response bias: what it is, the different forms it takes, and how to minimize its impact on your data quality.

You spend hours crafting the perfect survey. You distribute it to the right audience. The responses come flooding in. But when you dig into the results, something feels off—the data tells a story that doesn't match reality. The culprit, more often than not, is response bias.
Response bias is one of the most common and most underestimated threats to survey data quality. It distorts your results quietly, and it can lead you to make confident decisions based on unreliable information. For researchers, marketers, HR professionals, and anyone who relies on survey data to guide strategy, understanding response bias isn't optional—it's essential.
This guide covers what response bias is, the different forms it takes, and practical steps you can take to minimize its impact on your surveys.
What is response bias?
Response bias is a broad term for any tendency that causes survey participants to answer inaccurately or untruthfully. It doesn't necessarily mean people are lying—though sometimes they are. More often, bias stems from subtle psychological pressures, poor question design, or the survey experience itself nudging people toward certain answers.
The problem with response bias is that it's systematic. Random errors tend to cancel each other out across a large enough sample. Bias doesn't. If your survey consistently pushes respondents in one direction, collecting more responses just gives you a larger pile of skewed data.
Think of it this way: a broken compass is worse than no compass at all. No compass forces you to acknowledge uncertainty. A broken compass gives you false confidence.
Why response bias matters
Survey data informs product launches, hiring decisions, customer experience strategies, policy changes, and budget allocations. When that data is biased, every downstream decision inherits the distortion.
A customer satisfaction survey that overestimates happiness might prevent you from addressing problems that are quietly driving churn. An employee engagement survey that underestimates dissatisfaction might lull leadership into complacency until top talent starts leaving. A market research survey with social desirability bias might suggest demand for a product that nobody actually wants to buy.
The stakes are real. And the frustrating part is that biased data often looks perfectly normal on the surface. The percentages add up. The charts look clean. It's only when you act on the results—and things don't go as planned—that you realize something was wrong at the collection stage.
Types of response bias
Response bias isn't a single phenomenon. It shows up in several distinct forms, each with its own triggers and solutions.
Social desirability bias
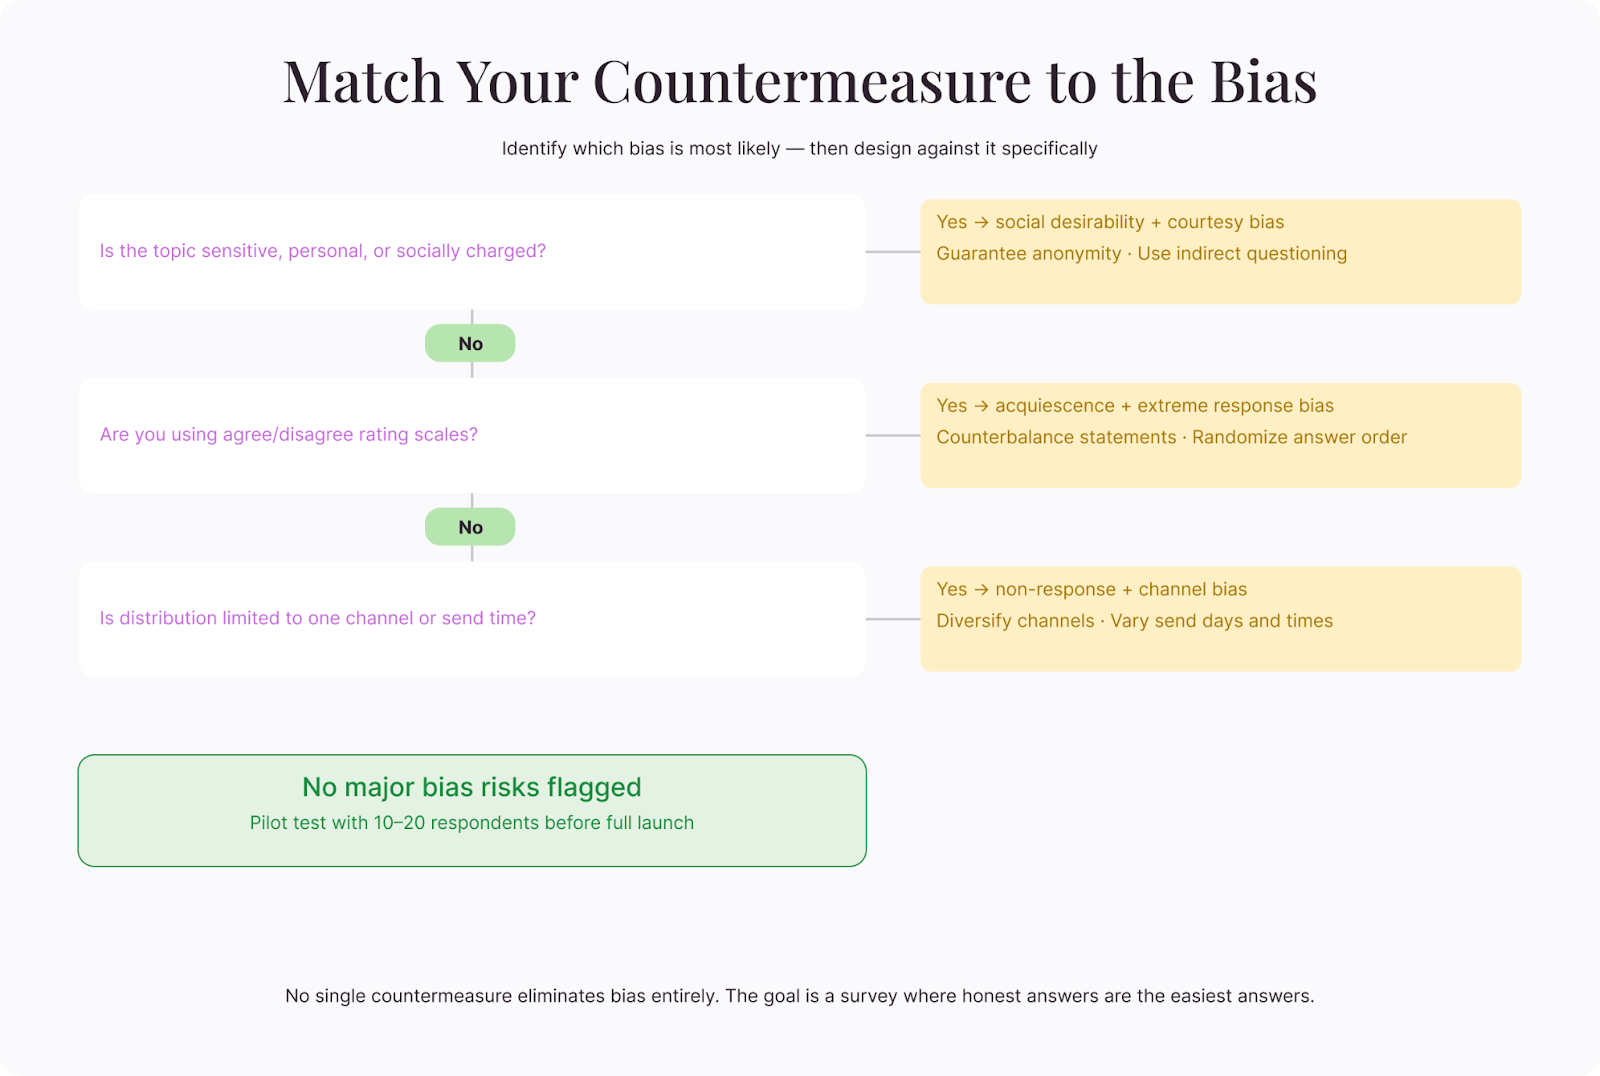
This is the big one. Social desirability bias occurs when respondents give answers that make them look good rather than answers that are true. People overreport behaviors they consider positive (exercising, recycling, reading) and underreport behaviors they consider negative (drinking, screen time, skipping work).
It's a deeply human tendency. Nobody wants to admit—even to an anonymous survey—that they spend four hours a day on social media or that they've never read the company's values statement. The more sensitive or socially charged the topic, the stronger this bias becomes.
Health surveys are particularly vulnerable. People underreport calorie intake and overreport physical activity. But social desirability bias shows up everywhere—in political polling (the "shy voter" effect), in customer surveys ("Yes, I always read the terms and conditions"), and in workplace feedback ("I strongly agree that I'm engaged with my work").
Acquiescence bias
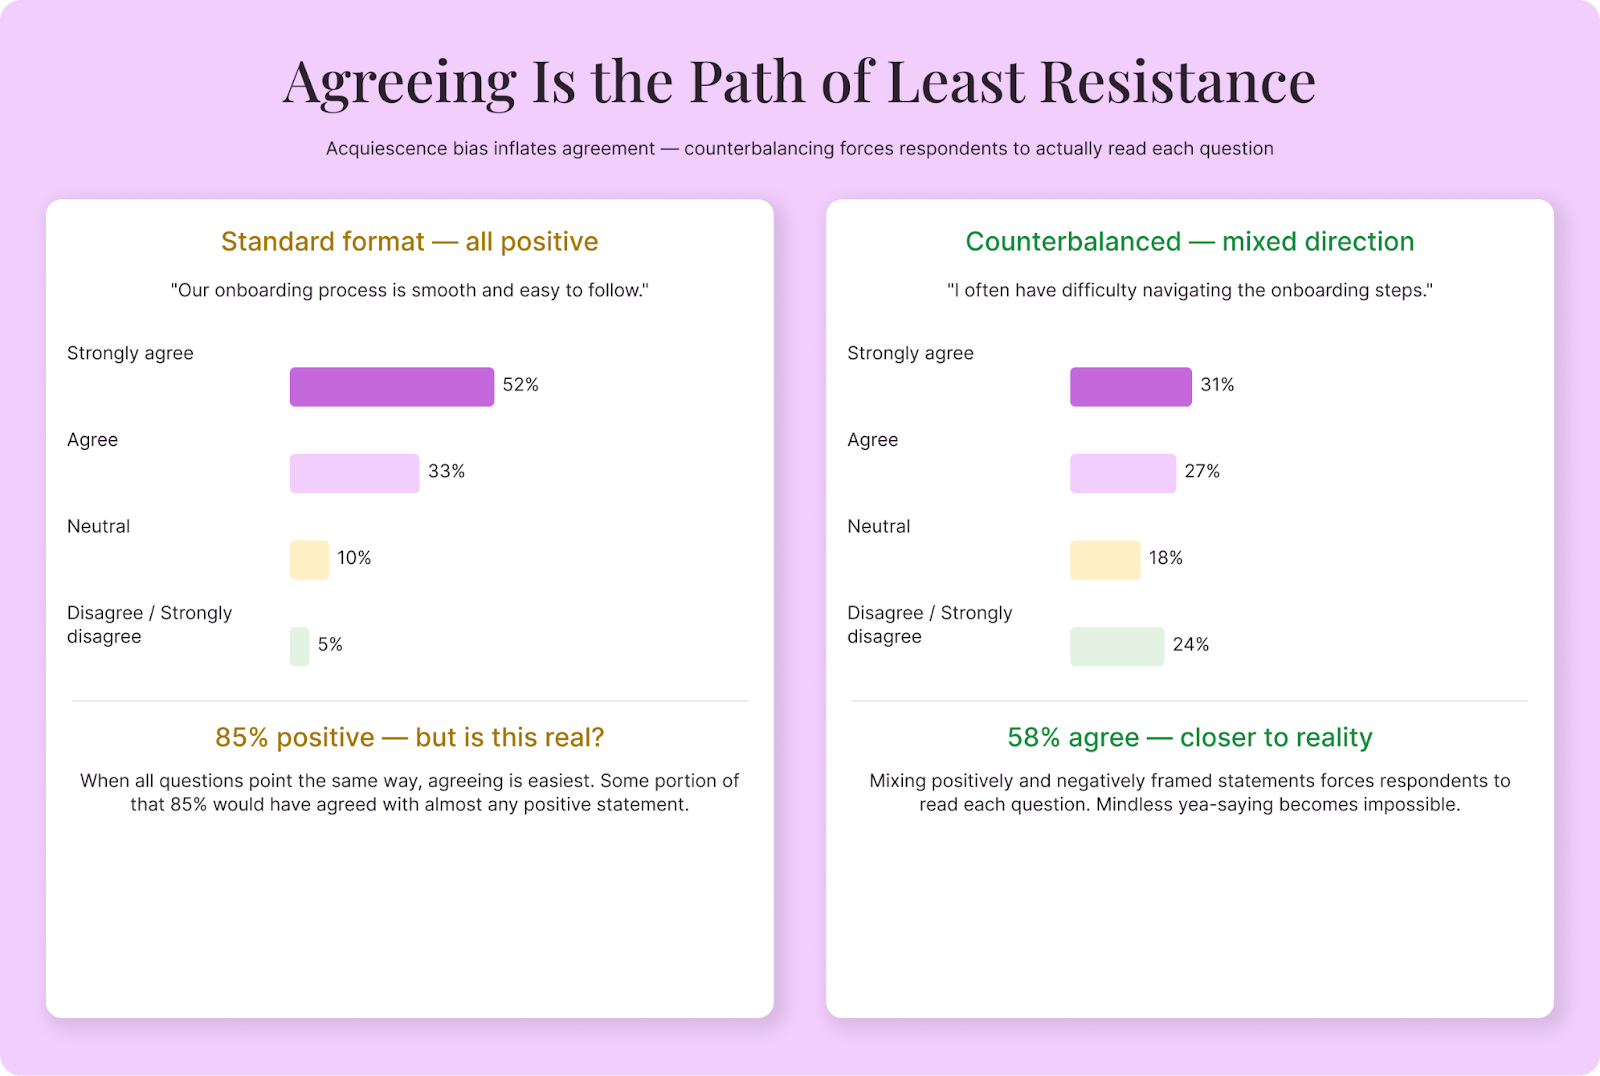
Acquiescence bias—sometimes called "yea-saying"—is the tendency to agree with statements regardless of their content. If you present a statement like "Our customer service team is responsive and helpful," a significant portion of respondents will agree simply because agreeing is the path of least resistance.
This bias is especially pronounced in long surveys, where respondent fatigue sets in and people start clicking "agree" just to get through it. It's also more common in cultures where disagreement is considered impolite.
The result is data that skews positive, which feels good when you're reading it but doesn't reflect reality. If 85% of respondents "agree" that your onboarding process is smooth, but 40% of them would have agreed with any positive statement you put in front of them, that 85% doesn't mean what you think it means.
Demand characteristics
Demand characteristics occur when respondents try to figure out what the survey is "really about" and adjust their answers to match. If a survey is clearly sponsored by a company and asks about that company's products, respondents may give more favorable answers because they sense that's what's expected.
This is different from social desirability bias. It's not about looking good in general—it's about giving the "right" answer for the specific context. Respondents become amateur mind-readers, trying to satisfy the person behind the survey.
Extreme responding
Some respondents consistently choose the most extreme options on rating scales—always selecting "strongly agree" or "strongly disagree," never landing in the middle. This pattern, called extreme responding, inflates the apparent intensity of opinions and can make your data look more polarized than it actually is.
Extreme responding varies across cultures and personality types. It's also more common when respondents are disengaged or when the topic doesn't matter much to them. Paradoxically, they express strong opinions precisely because they haven't thought carefully about the question.
Central tendency bias
The opposite of extreme responding, central tendency bias is when respondents consistently choose the middle option on rating scales. Whether the question is about satisfaction, agreement, or likelihood, they park themselves squarely at "neutral" or "somewhat agree."
This tends to happen when respondents are uncertain, indifferent, or reluctant to commit to a position. It compresses your data into a narrow range, making it harder to distinguish between groups or detect meaningful differences.
Recency and primacy effects
The order in which you present answer options matters more than most people realize. Primacy effect is the tendency to choose options listed first. Recency effect is the tendency to choose options listed last. Both can skew your results, particularly in long lists of multiple-choice options.
In visual surveys (online, on paper), primacy effect tends to dominate—people are more likely to pick early options because they're the first ones processed. In audio-based surveys (phone interviews), recency effect is stronger because the last options mentioned are freshest in memory.
Non-response bias
Strictly speaking, non-response bias isn't about how people answer—it's about who answers at all. If certain segments of your target audience systematically don't respond to your survey, your results represent only the people who did respond, which may be a very different group.
People with strong opinions (positive or negative) are more likely to complete surveys. People who are busy, disengaged, or indifferent are less likely. This means your data may overrepresent the extremes and underrepresent the quiet middle—the very people whose opinions might matter most for your decisions.
Courtesy bias
Courtesy bias is especially prevalent in face-to-face settings and in cultures that prioritize harmony and politeness. Respondents give favorable or agreeable answers to avoid causing offense, particularly when they're interacting with someone who clearly has a stake in the outcome.
If a hotel receptionist asks "How was your stay?" at checkout, most guests say "Great, thanks" regardless of their actual experience. The social pressure of a face-to-face interaction overwhelms the impulse to be honest. The same dynamic plays out in phone surveys, in-person interviews, and any situation where the respondent can sense a human on the other end who might be affected by criticism.
Sponsor bias
When respondents know who commissioned the survey, their answers shift. A customer satisfaction survey clearly branded with your company logo triggers a different mindset than a neutral third-party study. Some respondents become more favorable (wanting to be polite or fearing consequences). Others become more critical (using the survey as a complaint channel). Either way, the sponsorship changes the data.
The degree of sponsor bias depends on the relationship. Employees surveyed by their employer about workplace satisfaction face obvious pressure to self-censor. Customers surveyed by a brand they depend on may soften criticism. Even academic research isn't immune—participants in a study funded by a pharmaceutical company may unconsciously give responses that align with the study's implied hypothesis.
Recall bias
Recall bias occurs when respondents' memories of past events are inaccurate, incomplete, or influenced by what's happened since. Human memory isn't a recording—it's a reconstruction that's reshaped every time you access it. Asking someone to recall their experience from three months ago produces data about their current impression of that experience, which isn't the same thing.
This bias is strongest when the recall period is long, when the event wasn't particularly memorable, or when subsequent events have reframed the original experience. A customer who's since had a terrible support interaction may remember their overall onboarding experience as worse than they felt at the time.
How to reduce response bias
You can't eliminate response bias entirely. But you can design surveys that minimize its influence. Here are the most effective strategies:
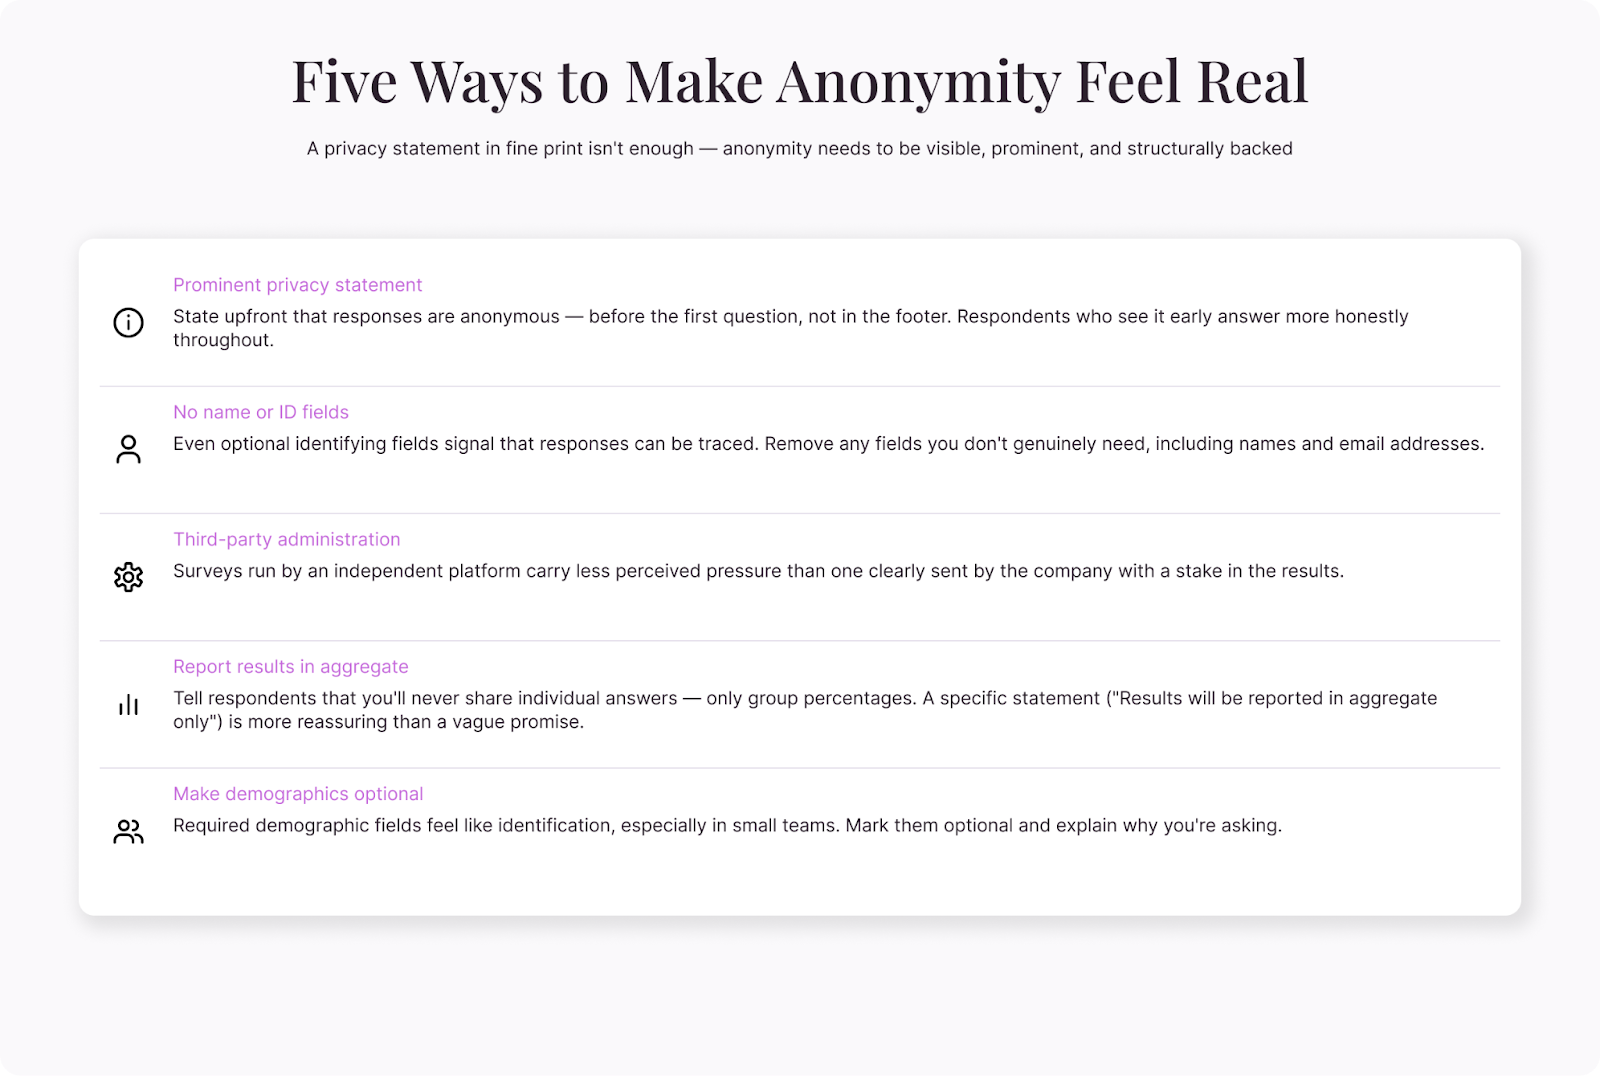
Guarantee and emphasize anonymity
When people believe their responses truly can't be traced back to them, they're more likely to answer honestly. This is especially important for sensitive topics—employee feedback about management, health-related behaviors, or anything people might feel judged for.
Don't just promise anonymity in fine print. Make it prominent. Explain it at the beginning of the survey. And back it up structurally—don't collect identifying information unless you absolutely need it, and separate demographic data from sensitive responses when possible.
Use neutral, balanced question wording
Leading questions are the most preventable source of response bias. Compare these two versions:
"How satisfied are you with our excellent customer support?" vs. "How would you describe your experience with our customer support?"
The first version signals the "right" answer. The second invites an honest one. Audit every question in your survey for embedded assumptions, loaded language, and implied expectations.
Watch for subtle framing effects too. "How much do you support increased funding for education?" will get different results than "How should the government allocate its limited budget across education, healthcare, infrastructure, and defense?" The first frames education funding as an isolated good. The second forces trade-offs, which is closer to how real decisions work.
Counterbalance agreement scales
To combat acquiescence bias, mix positively and negatively worded statements. Instead of asking respondents to rate five positive statements about your service, include statements like "I often have difficulty reaching customer support" alongside "Customer support resolves my issues quickly."
When respondents encounter both positively and negatively framed items, mindless yea-saying becomes impossible—agreeing with both contradictory statements would be obviously inconsistent. This forces more thoughtful engagement with each question.
Be careful with this technique, though. Negatively worded items can confuse respondents if the phrasing is awkward. Double negatives are particularly dangerous: "I don't disagree that the onboarding process isn't confusing" will baffle anyone trying to answer honestly.
Randomize answer options
Primacy and recency effects are easy to counteract: randomize the order of answer options for each respondent. Most online survey platforms support this feature. When option order varies across respondents, positional bias averages out across your sample.
The exception is when options have a natural order—like rating scales from "strongly disagree" to "strongly agree" or numerical ranges from low to high. Randomizing these would confuse respondents and introduce more problems than it solves.
Keep surveys short and focused
Survey fatigue is a bias amplifier. The longer your survey, the more likely respondents are to speed through questions, default to acquiescence, pick random answers, or abandon the survey entirely (creating non-response bias).
A good rule of thumb: if you can't complete the survey yourself in under 10 minutes while reading carefully, it's too long. Every question should earn its place by directly serving a research objective. If you can't explain why a question is there and how you'll use the answer, cut it.
Use indirect questioning for sensitive topics
When direct questions are likely to trigger social desirability bias, indirect techniques can help. Instead of asking "Do you exercise regularly?" (which most people will say yes to), ask "How many times did you exercise in the last seven days?" Specific behavioral questions are harder to inflate than general self-assessments.
Other indirect techniques include:
- Third-person framing – "How common do you think it is for people in your role to feel overwhelmed at work?" People project their own experiences onto "people in general" while feeling less exposed.
- Randomized response technique – A statistical method where respondents answer the real question or an innocuous one based on a random mechanism (like a coin flip). The individual responses are ambiguous, but the aggregate data can be analyzed to estimate the true prevalence of sensitive behaviors.
- List experiments – Respondents see a list of items and report the total number that apply to them. The sensitive item is embedded in the list, so the researcher can estimate its prevalence without any individual revealing their answer.
Pilot test with real respondents
Before launching, test your survey with a small group from your target audience. Ask them to think aloud as they complete it. Listen for confusion, hesitation, or moments where they seem to be guessing what you want to hear.
Pilot testing catches problems that internal review misses. You might think a question is perfectly clear until you watch someone misinterpret it in a way you never anticipated.
Diversify your distribution channels
If you only distribute your survey through one channel—say, an email list—you'll only reach people who are active on that channel. Broadening distribution across email, social media, in-app prompts, and other touchpoints helps you reach a more representative sample and reduces non-response bias.
Consider the timing, too. Surveys sent on Monday morning will catch a different mood than surveys sent on Friday afternoon. Spreading distribution across different times and days helps smooth out temporal biases.
Offer appropriate incentives—carefully
Incentives increase response rates, which helps combat non-response bias. But the type of incentive matters. Cash and gift cards work across most populations. Discounts and product perks attract existing customers (reinforcing selection bias). Entries into prize draws are less effective per person but cheaper across large groups.
The risk is that incentives attract "professional respondents" who complete surveys quickly for the reward without giving thoughtful answers. To mitigate this, use attention-check questions, analyze completion times, and keep the incentive proportional—enough to motivate participation, not enough to attract people who have no real connection to the topic.
How to detect response bias after collection
Even with careful design, some bias will slip through. Here are ways to spot it in your data:
- Straight-lining detection – Look for respondents who selected the same answer for every question, especially on rating scales. This pattern suggests they weren't reading the questions.
- Completion time analysis – Flag responses completed in an unusually short time. Someone who finishes a 10-minute survey in 90 seconds wasn't giving thoughtful answers.
- Consistency checks – Include a pair of similar questions phrased differently and compare the answers. Large discrepancies suggest careless responding.
- Compare early vs. late responses – If late-survey answers cluster more tightly around neutral options, fatigue bias may be at play.
- Analyze non-response patterns – Compare the demographics of respondents vs. your target population. If certain groups are underrepresented, your results may not generalize.
- Compare to known benchmarks – If industry data or previous research exists on the same topic, compare your results. Dramatic differences don't automatically mean bias, but they warrant investigation. If your internal satisfaction scores are 20 points above the industry average, either you're genuinely exceptional or something in your methodology is inflating the numbers.
- Look at drop-off patterns – Where in the survey do people abandon? If a large percentage drop off at a specific question, that question may be confusing, too personal, or signaling that the survey is going to take longer than expected. The people who leave aren't randomly distributed—they're systematically different from those who stay.
Handling bias in specific survey types
Different survey contexts invite different biases, and knowing which ones to expect helps you prepare.
Employee surveys are heavily affected by social desirability and courtesy bias. Employees worry—regardless of anonymity promises—that negative feedback could affect their standing. Third-party administration, suppressed results for small teams, and demonstrated follow-through on past feedback are the strongest countermeasures.
Customer satisfaction surveys frequently suffer from non-response bias and extreme responding. Satisfied customers and deeply dissatisfied ones are most likely to respond; the ambivalent middle often stays silent. Triggered surveys (sent immediately after an interaction) capture a broader range of experiences than periodic surveys that rely on customers to self-motivate.
Health and behavior surveys are the highest-risk territory for social desirability bias. Self-reported exercise frequency, dietary habits, substance use, and screen time are almost always inaccurate when asked directly. Indirect questioning, specific behavioral anchors ("How many times in the last seven days did you\..."), and technology-assisted measurement (step counters, usage logs) all produce more accurate data than broad self-assessment.
Political and opinion polls face acquiescence bias, social desirability bias, and the "shy voter" effect—where people conceal their true preferences because they perceive them as socially unacceptable. Randomized response techniques and list experiments are the primary tools for reducing this distortion, though no method eliminates it entirely.
Building surveys that earn honest answers
Reducing response bias isn't just about technique—it's about respect. When you design a survey that's clear, concise, and genuinely interested in what people think (rather than fishing for validation), respondents notice. They engage more carefully. They answer more honestly.
The opposite is also true. A long, confusing, obviously self-serving survey signals that the creator doesn't value the respondent's time or input. And people respond accordingly—rushing through, telling you what you want to hear, or abandoning the survey altogether.
Every design choice sends a message. Neutral wording says, "I want your real opinion." Anonymity says, "I won't judge you." Brevity says, "I respect your time." These messages, taken together, create the conditions for honest data.
Response bias will never disappear completely. Humans are complicated, and the act of asking questions inevitably changes the answers you get. But a thoughtfully designed survey—one that anticipates bias and builds in countermeasures—gets you close enough to the truth to make decisions you can trust.

.png)