What is a representative sample? (Beginner-friendly guide)
Discover how to build a representative sample, avoid common biases, and collect survey data you can actually trust to guide decisions.
.jpg)
Imagine running a survey to learn what your customers think about a new feature. You send it to your email list, collect 500 responses, and the results look great—82% approval. You're ready to celebrate. Then someone points out that your email list skews heavily toward power users who already love your product. The 500 responses you collected don't represent your full customer base. They represent the people most likely to say yes.
This is the difference between a sample and a representative sample. And it's one of the most consequential distinctions in research.
A representative sample accurately reflects the characteristics of the larger population you're trying to study. When your sample is representative, you can confidently generalize your findings. When it's not, your conclusions apply only to the specific group you happened to reach—no matter how many responses you collected.
Why representativeness matters more than size
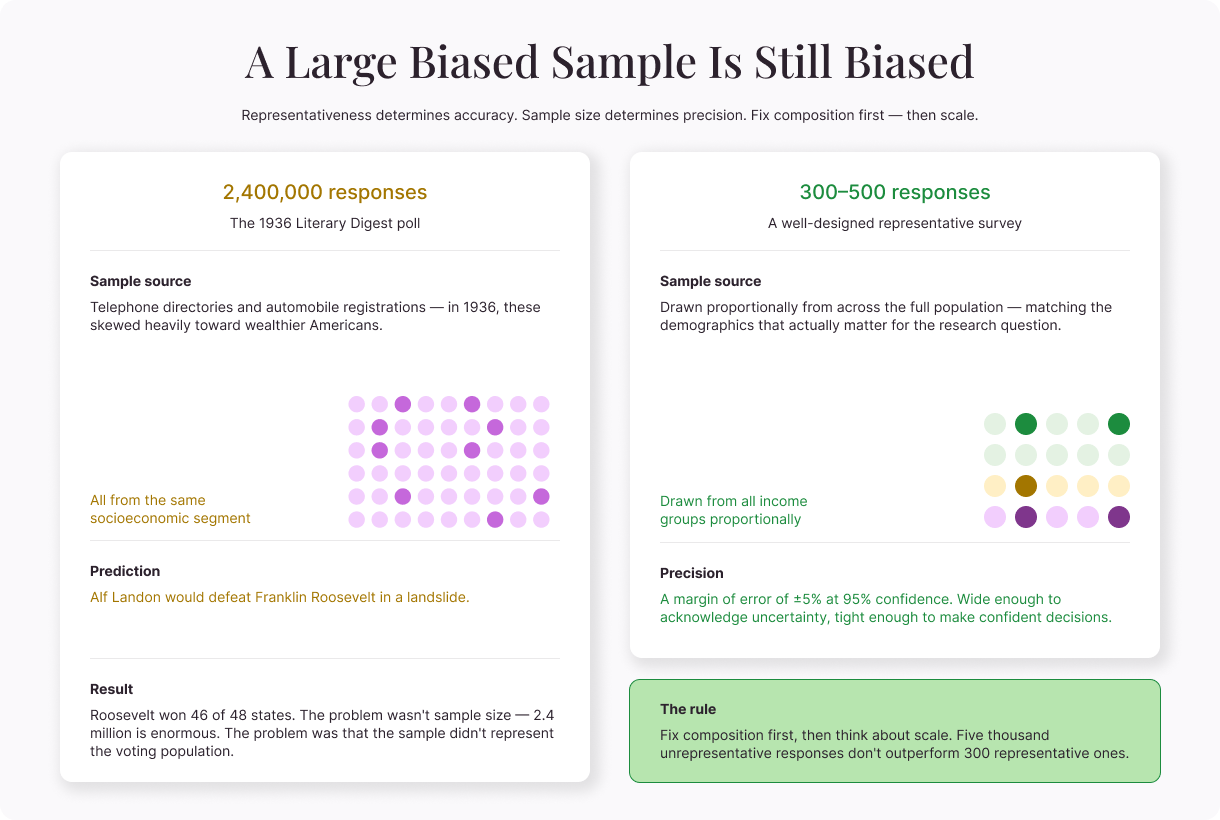
There's a persistent myth that more responses automatically mean better data. It's intuitive but wrong. A large biased sample is still biased. Collecting 10,000 responses from the wrong group doesn't bring you any closer to understanding the right one.
The classic cautionary tale comes from the 1936 U.S. presidential election. A magazine polled 2.4 million people and predicted that Alf Landon would defeat Franklin Roosevelt in a landslide. But Roosevelt won 46 of 48 states. The problem wasn't sample size—2.4 million is enormous. The problem was that the magazine drew its sample from telephone directories and automobile registrations, which in 1936 skewed heavily toward wealthier Americans. The sample didn't represent the voting population.
Sample size still matters. But it matters after representativeness, not instead of it. A small representative sample will give you more accurate results than a massive unrepresentative one.
What makes a sample representative
A representative sample mirrors the population it's drawn from across the characteristics that matter for your research. "The characteristics that matter" is the key phrase—you don't need your sample to match the population on every possible dimension, just the ones relevant to your question.
If you're studying purchasing behavior, you'd want your sample to reflect the population's age distribution, income levels, and geographic spread because those factors influence how people buy. You probably wouldn't need to match the population on eye color or shoe size, because those traits are irrelevant to purchasing decisions.
The characteristics you need to match depend entirely on what you're studying. There's no universal checklist. Identifying the right dimensions requires thinking carefully about what factors could plausibly influence the outcome you're measuring.
How to build a representative sample
Several sampling methods can help you achieve representativeness. Each has its strengths and practical constraints, so having a clear understanding is crucial.
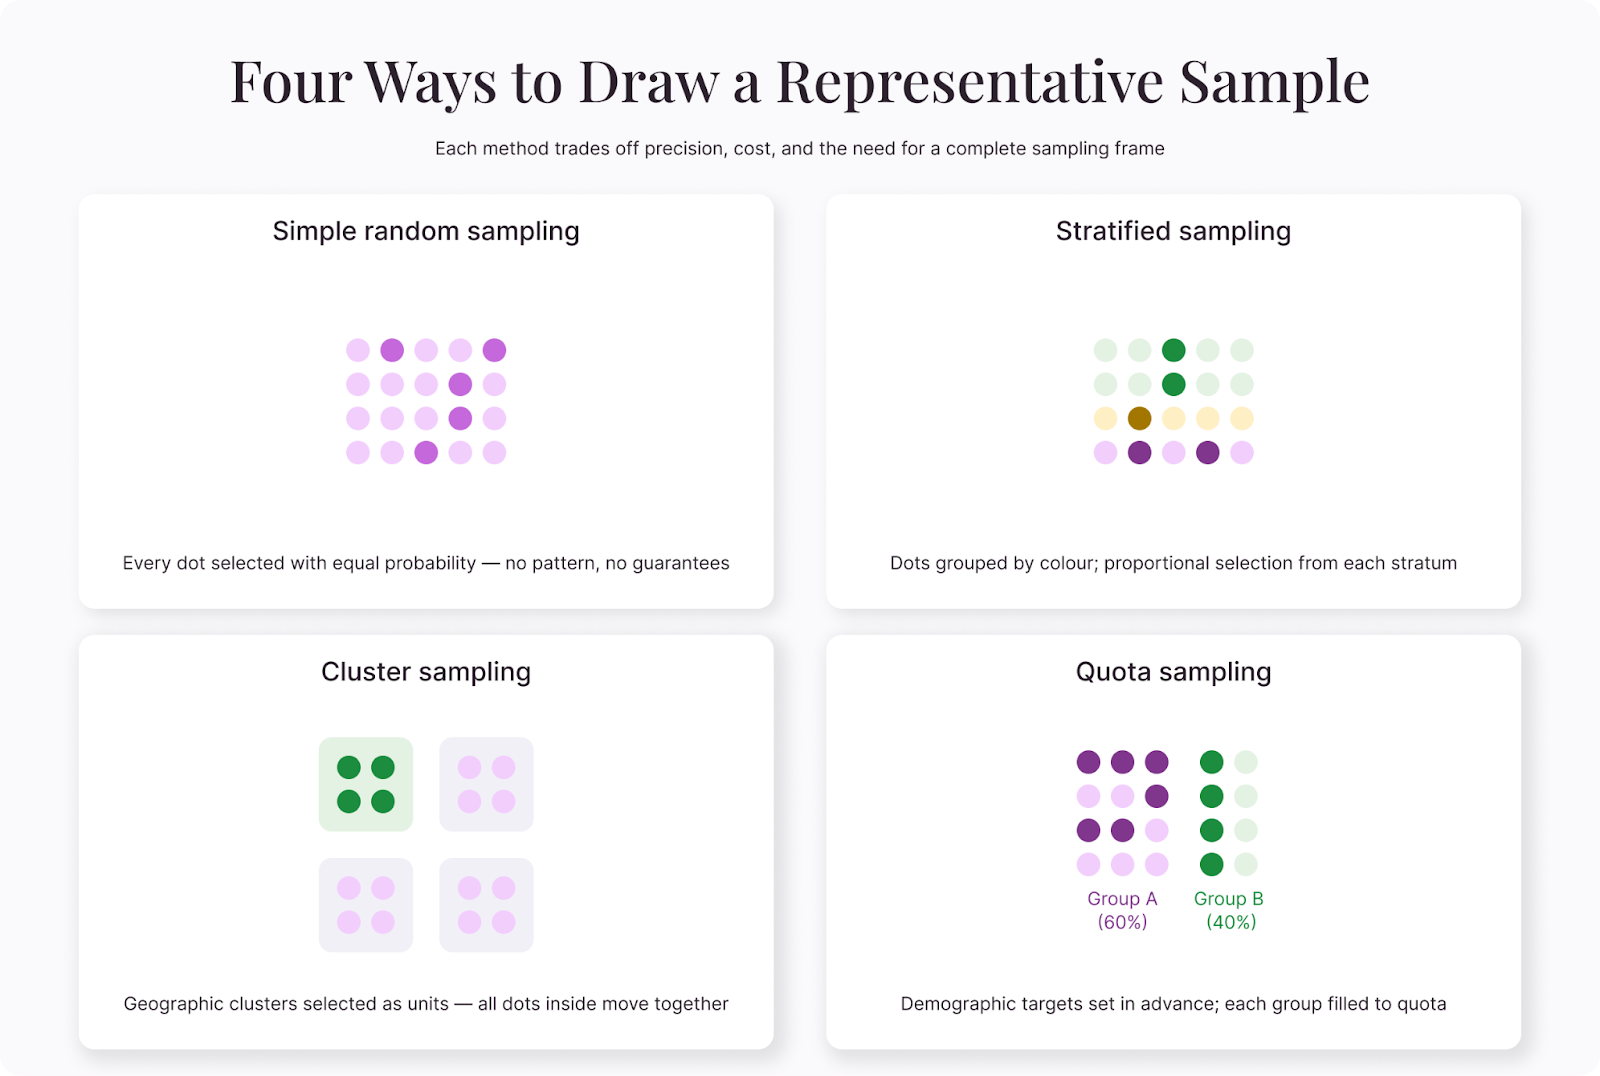
Simple random sampling
Every member of the population has an equal chance of being selected. This is the theoretical ideal—it eliminates systematic bias by leaving selection entirely to chance. In practice, it requires a complete list of the population (a sampling frame), which isn't always available.
If you have a database of all 50,000 customers, you can use a random number generator to select 500 of them. Each customer has the same probability of selection, so the resulting sample should reflect the full customer base, assuming a decent response rate.
Stratified sampling
Stratified sampling divides the population into subgroups (strata) based on a key characteristic and then samples from each subgroup proportionally. If your customer base is 60% in North America, 25% in Europe, and 15% in Asia, you'd sample from each region in those proportions.
This method guarantees that important subgroups are represented, which simple random sampling doesn't always achieve, especially with small samples. If you randomly select 100 people from a population that's 5% rural, you might end up with zero rural respondents by chance. Stratified sampling prevents that.
Cluster sampling
When you can't access the full population directly, cluster sampling offers a practical workaround. You divide the population into clusters (usually geographic), randomly select some clusters, and then survey everyone (or a random subset) within the chosen clusters.
This is common in large-scale public health and social research, where surveying an entire country is logistically impossible. Instead, researchers randomly select cities or districts and survey within those. The trade-off is precision—cluster samples typically have higher margins of error than other methods. However, the gain in feasibility often makes it worthwhile.
Quota sampling
Quota sampling sets targets for specific demographic groups and recruits respondents until each quota is filled. It's similar to stratified sampling but doesn't require a sampling frame or random selection. Researchers recruit respondents from wherever they can find them, as long as the final sample hits the predetermined demographic proportions.
This is the most practical option for many business surveys. You decide that your sample needs to be 50% female, 30% aged 25-34, 40% from the West Coast—whatever proportions match your target population—and you recruit accordingly.
The weakness is that non-random selection within each quota can introduce bias. Two people who both fit the "female, 25-34, West Coast" profile might have very different perspectives, and the ones who happen to see your survey may not represent the others.
Common threats to representativeness
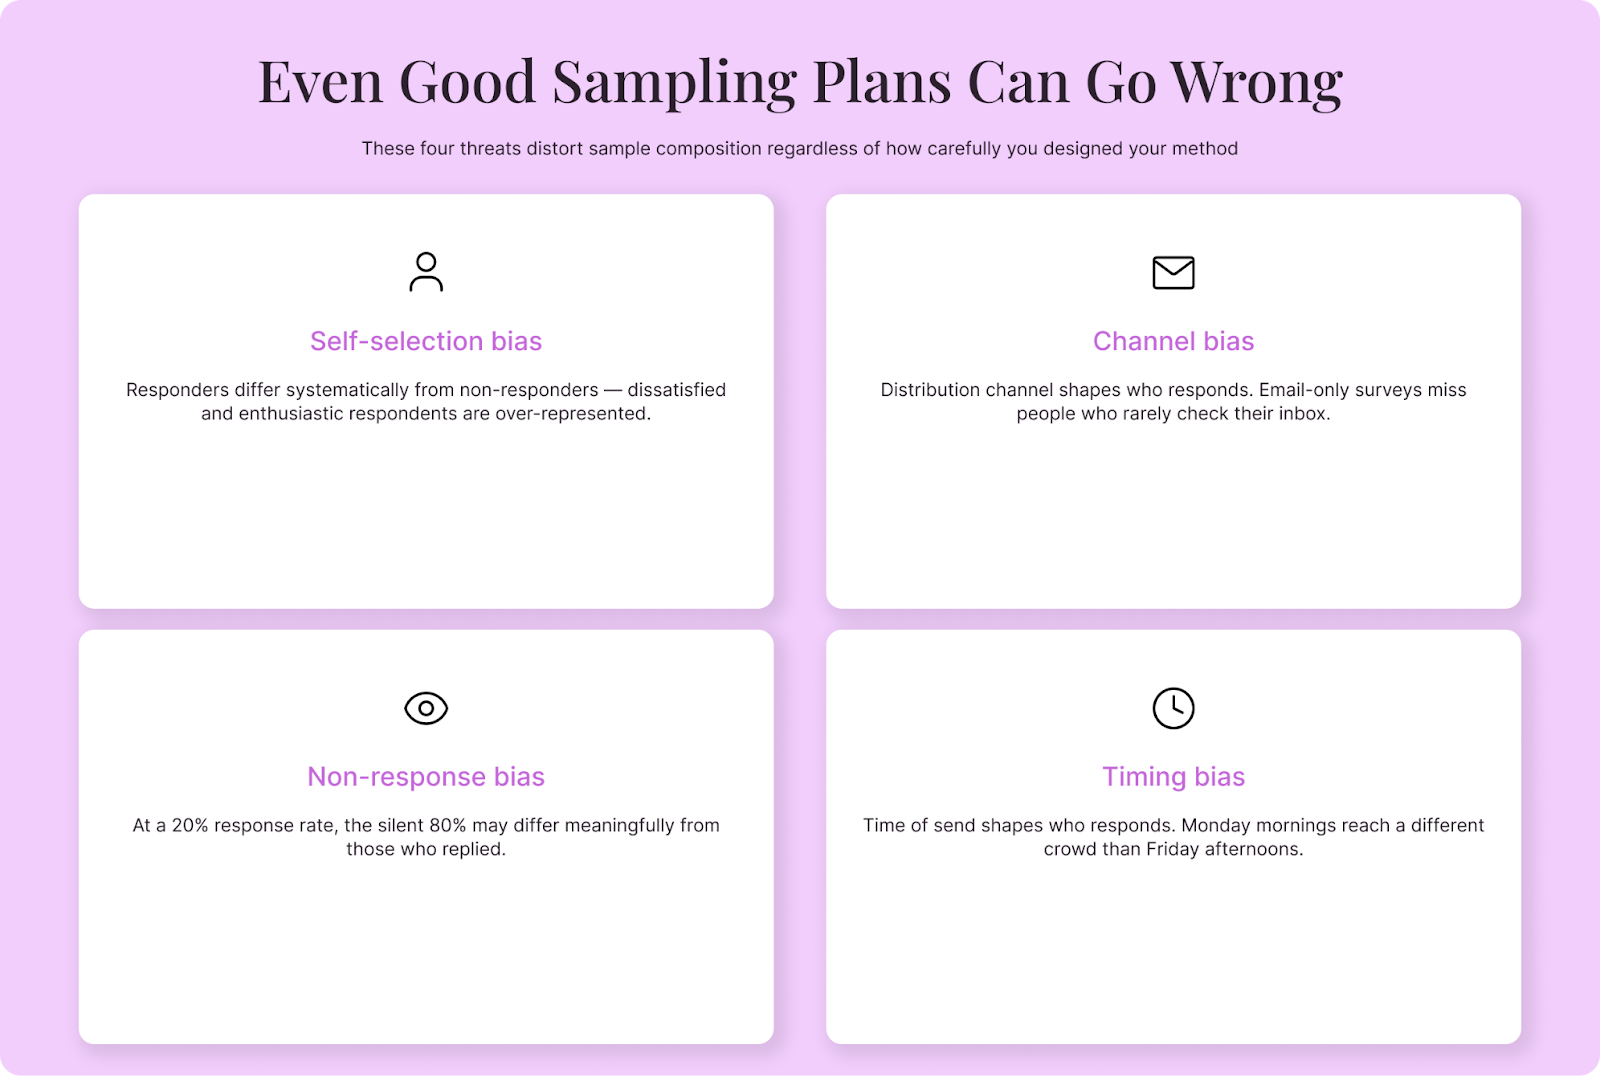
Even well-designed sampling plans can produce unrepresentative results. Here are common threats to know and avoid:
Self-selection bias happens when participation is voluntary. People who choose to respond often differ systematically from those who don't. Dissatisfied customers might be more motivated to fill out a feedback survey, or enthusiastic early adopters might overrepresent themselves in product research.
Channel bias occurs when your distribution method reaches only part of the population. An email-only survey misses people who rarely check email. A social media survey overrepresents active social media users. Distributing through multiple channels helps reduce this.
Non-response bias is the gap between who you invite and who actually responds. If your survey has a 20% response rate, you need to ask whether the 80% who didn't respond differ meaningfully from the 20% who did. Often, they do.
Timing bias affects who's available to respond. A survey sent during business hours captures people at their desks. One sent on weekends captures a different crowd. The time and day of distribution shapes who you hear from.
How to check if your sample is representative
After collecting responses, compare your sample's demographics to the known demographics of your population. If your customer base is 45% male and 55% female, but your survey responses are 70% male and 30% female, you have a representativeness problem.
When you find mismatches like this, you have two options:
- Collect more targeted responses. Send reminders to underrepresented groups, use different distribution channels, or extend the survey period.
- Weight the data. Statistical weighting adjusts the influence of each response so that underrepresented groups count more and overrepresented groups count less. Weighting can correct moderate imbalances, but it can't rescue a fundamentally flawed sample—if an entire segment is missing, there's nothing to weight up.
How sample size and representativeness work together
Once you've addressed representativeness, sample size determines how precise your estimates are. A representative sample of 100 gives you accurate but imprecise results—you know you're measuring the right group, but the margin of error is wide. A representative sample of 1,000 gives you both accuracy and precision.
The relationship follows a curve of diminishing returns. Going from 100 to 500 respondents dramatically tightens your margin of error. Going from 500 to 1,000 tightens it further, but less dramatically. Going from 1,000 to 5,000 barely moves the needle. For most business surveys, 300-500 representative responses provide a solid foundation for decision-making.
The important caveat to note here is that these numbers assume your sample is representative. Five thousand unrepresentative responses don't outperform 300 representative ones. Fix the composition first, then think about scale.
The practical bottom line
Perfect representativeness is an ideal, not a realistic expectation. Real-world constraints—budget, time, access—always force compromises. This means the goal isn't perfection. It's awareness.
Know which characteristics matter for your research. Choose a sampling method that addresses those characteristics. Check your results against the population you're trying to represent. And be transparent about the limitations when you report your findings.
A sample that you understand—including its flaws—is far more useful than one you assume is representative just because it's large. In other words, the question isn't "How many responses did we get?" It's "Do these responses reflect the people we actually need to hear from?"

.png)