What Is conjoint analysis? A practical guide for product and pricing decisions
People make decisions based on trade-offs. They weigh what matters most, rank priorities, and choose what delivers the best value for their needs. When you understand how your customers make those trade-offs, you can design products and set prices that actually resonate with them.

People make decisions based on trade-offs. They weigh what matters most, rank priorities, and choose what delivers the best value for their needs. When you understand how your customers make those trade-offs, you can design products and set prices that actually resonate with them.
This is where conjoint analysis comes in. It’s a research method that reveals which features, attributes, and price points your customers truly value—and how willing they are to sacrifice one thing for another.
This guide walks you through what conjoint analysis is, how it works, and why it matters for product development and pricing strategy.
What is conjoint analysis?
Conjoint analysis is a quantitative research technique that measures customer preferences by presenting respondents with realistic product scenarios and asking them to choose between different combinations of features, attributes, and prices.
The name itself hints at its purpose: “conjoint” means analyzing things “jointly.” Instead of asking customers “Do you like feature X?” in isolation, conjoint analysis asks them to evaluate features as they actually exist in the real world—bundled together, with trade-offs built in.
For example, instead of asking “Would you prefer a product with fast delivery?”, you’d present a scenario like this: “Product A costs $50, ships in 2 days, and includes premium support. Product B costs $30, ships in 5 days, and includes basic support. Which would you choose?” The respondent’s choice reveals their priorities.
Unlike traditional surveys that ask people to rate features one at a time, conjoint analysis forces a trade-off. Every choice the respondent makes includes both what they’re gaining and what they’re giving up. That constraint is what makes the data useful. A customer who has to choose between two imperfect options reveals their actual priorities, not just their preferences in isolation. This is closer to how purchasing works in the real world—where no product is ever perfect, and every decision involves saying no to something.
Conjoint analysis has roots in mathematical psychology and marketing research dating back to the 1970s. The method was originally developed to address a well-known problem in consumer research: what people say they want often differs from what they actually buy. Today, it’s become essential for companies developing new products, adjusting features, testing price points, and understanding market segments.
Why conjoint analysis matters for your business
Traditional market research often relies on direct questions: “How important is customer support to you?” The problem is that people don’t always know what they really want—or they answer based on what sounds good, not what they’d actually do.

Conjoint analysis sidesteps this problem by measuring revealed preferences instead of stated preferences. It shows you what customers actually value through their choices, not what they say they value in a survey.
This matters because the gap between what people say and what they do can be substantial. A customer might claim that sustainability is crucial, but when faced with a choice between an eco-friendly product at $80 and a conventional one at $40, their actual purchase reveals their real priority: price.
Researchers have documented this gap for decades. Customers often rank values like sustainability, quality, or service high on stated-preference surveys, then select the cheaper or more convenient option when they actually buy. Conjoint analysis captures that real behavior rather than the aspirational answer.
For product teams, conjoint analysis answers critical questions:
- Which features drive the most customer value?
- What price point maximizes both revenue and demand?
- How should you position your product against competitors?
- Which market segments have different preferences?
- What combination of features justifies a premium price?
For pricing specifically, conjoint analysis helps you avoid leaving money on the table. Many companies underprice because they don’t understand what customers will actually pay. Conjoint analysis finds the sweet spot by revealing price elasticity—how sensitive customers are to price changes and whether small increases might barely dent demand. It’s also useful in the other direction: companies sometimes discover they’ve been overpricing a feature set that customers don’t value nearly as much as leadership assumed.
How conjoint analysis works: the basic process
The methodology behind conjoint analysis is straightforward, though running a rigorous study requires careful planning.
Define your attributes and levels. Start by identifying the product attributes (features, benefits, price, delivery speed, warranty, support type) that matter to your customers. For each attribute, define the possible levels or options. If your attribute is “price,” your levels might be $25, $50, $75, and $100. If your attribute is “delivery speed,” your levels might be “next day,” “3–5 days,” or “1–2 weeks.” Select attributes that are genuinely distinct and meaningful to customers.
Create product profiles. Next, combine attributes and levels into realistic product scenarios. If you’re studying a software product, you might create profiles like:
- Plan A: $29/month, 3 users, email support
- Plan B: $79/month, unlimited users, email and chat support
- Plan C: $129/month, unlimited users, 24/7 phone support
Each profile should feel like a plausible product offering. Realistic profiles keep respondents engaged and produce more valid predictions about actual market behavior.
Present choices to respondents. Show respondents pairs or sets of these product profiles and ask which one they’d choose. Respondents might see simple pairwise comparisons or more complex choice sets. The number of choice tasks typically ranges from 8 to 20, depending on study complexity.
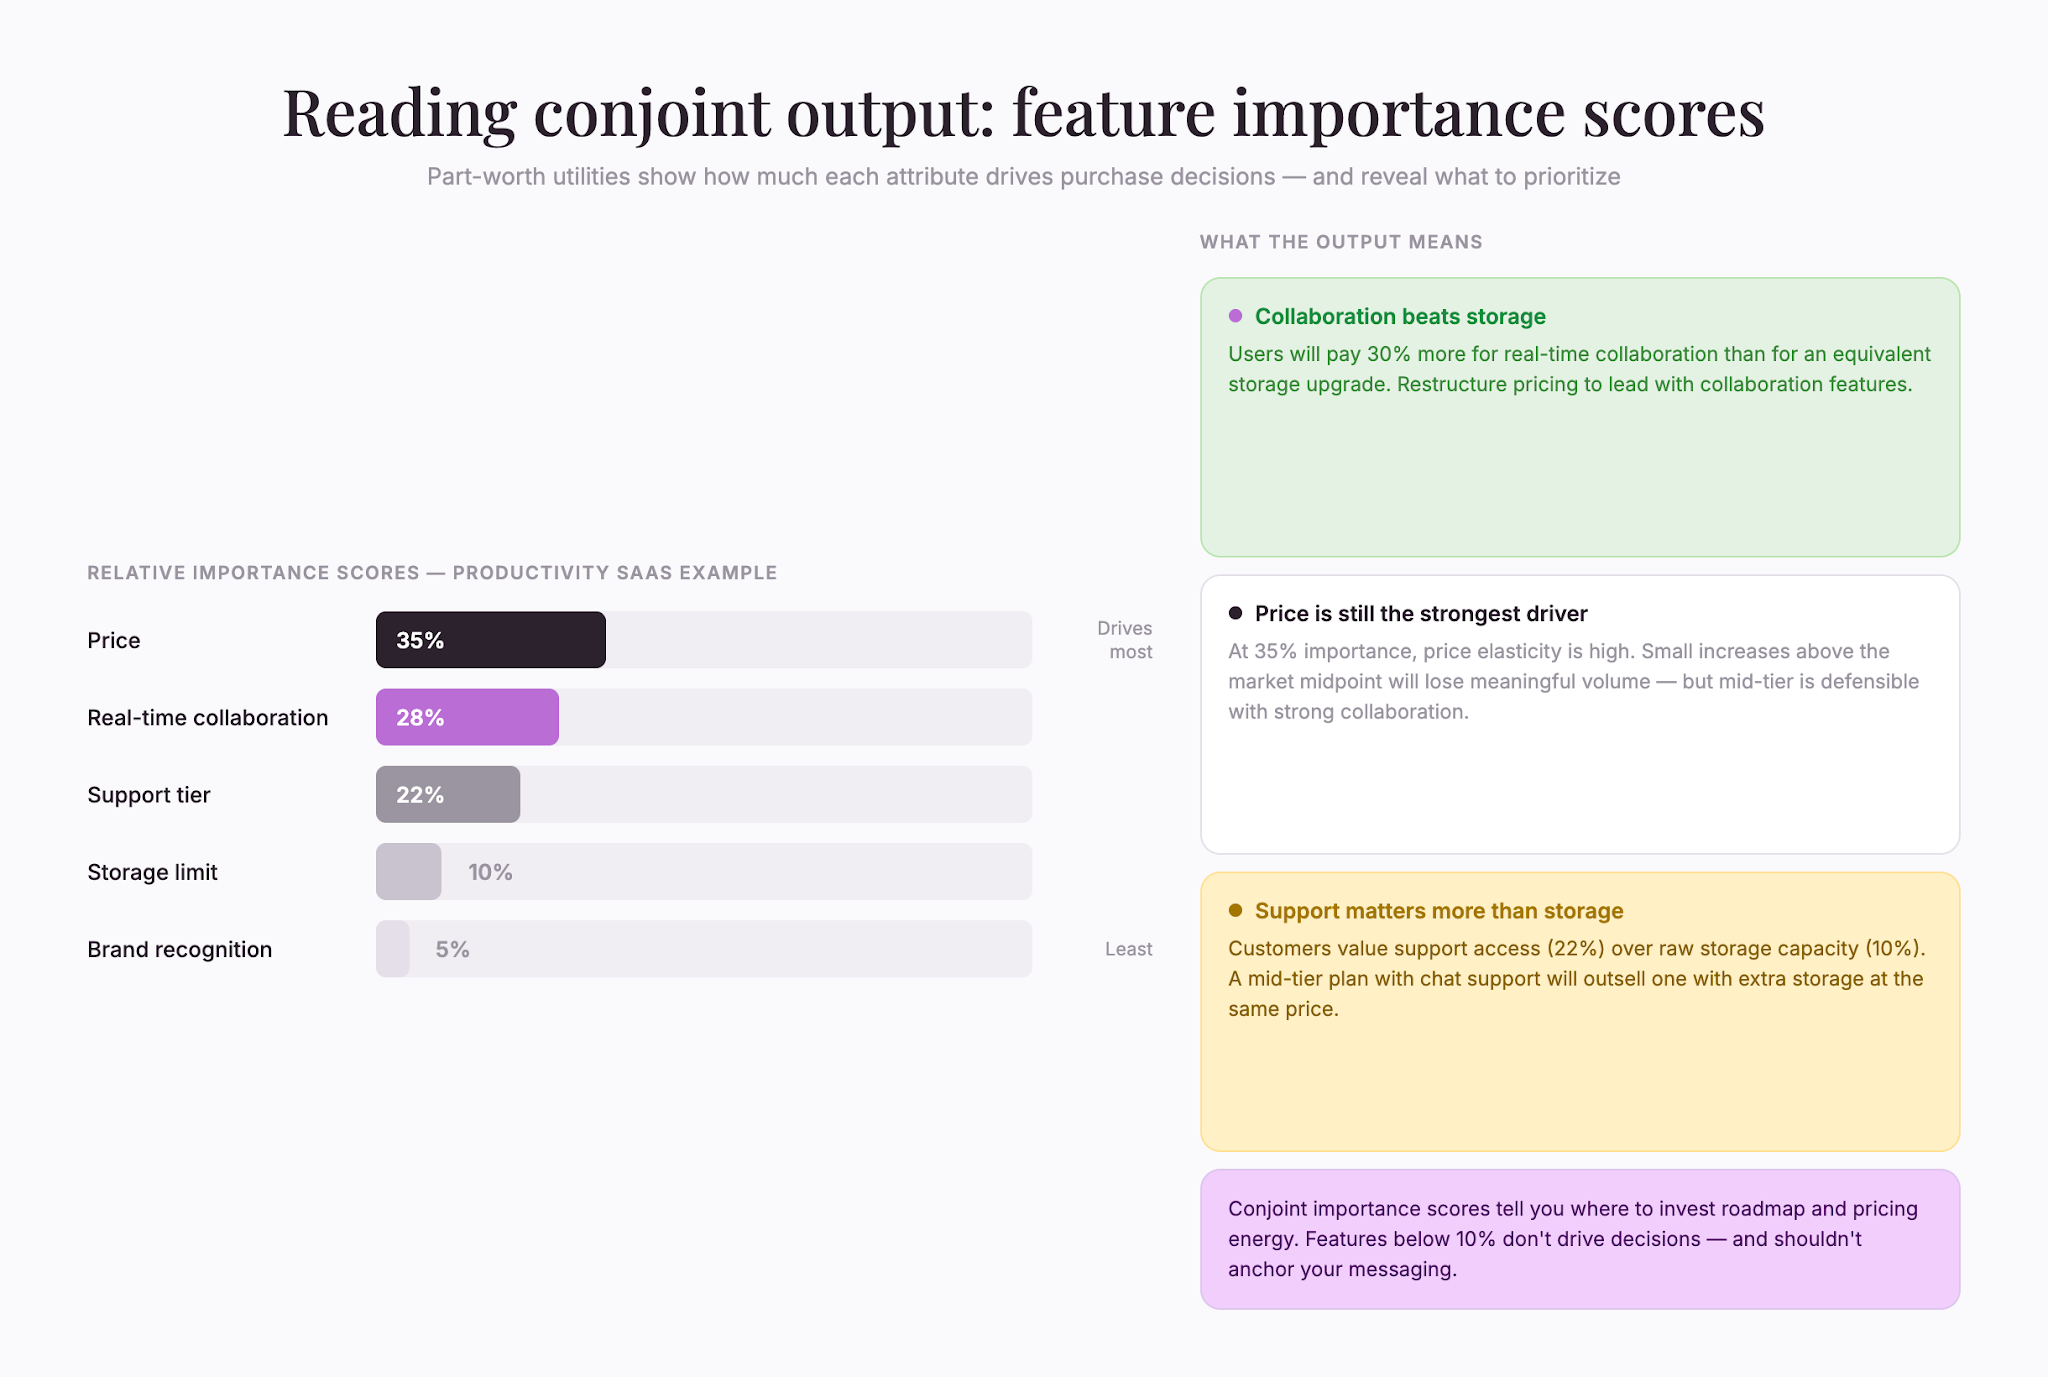
Analyze the results. Statistical analysis reveals the relative importance of each attribute and the value of each level. The software calculates “part-worth utilities”—numerical scores showing how much each feature contributes to a customer’s preference. A high utility score for “overnight shipping” tells you customers value that option substantially.
You’ll see two key metrics come out of the analysis. Part-worth utilities tell you how much each level of each attribute contributes to preference—think of them as the weight a customer assigns to each choice. Importance scores, derived from the utilities, tell you the relative weight of each attribute overall. A typical output might show that price accounts for 35% of a customer’s decision, followed by quality at 28%, support at 22%, and everything else splitting the remaining 15%. These scores are the practical output you can act on.
The output also shows you price sensitivity. By analyzing how respondents trade off price against other features, you learn the demand curve: how many customers will buy at each price point. This curve is invaluable for revenue forecasting and helps you model scenarios before committing to a price change in the market.
Types of conjoint analysis
Not all conjoint studies are run the same way. The method you choose depends on your research question, sample size, and complexity.
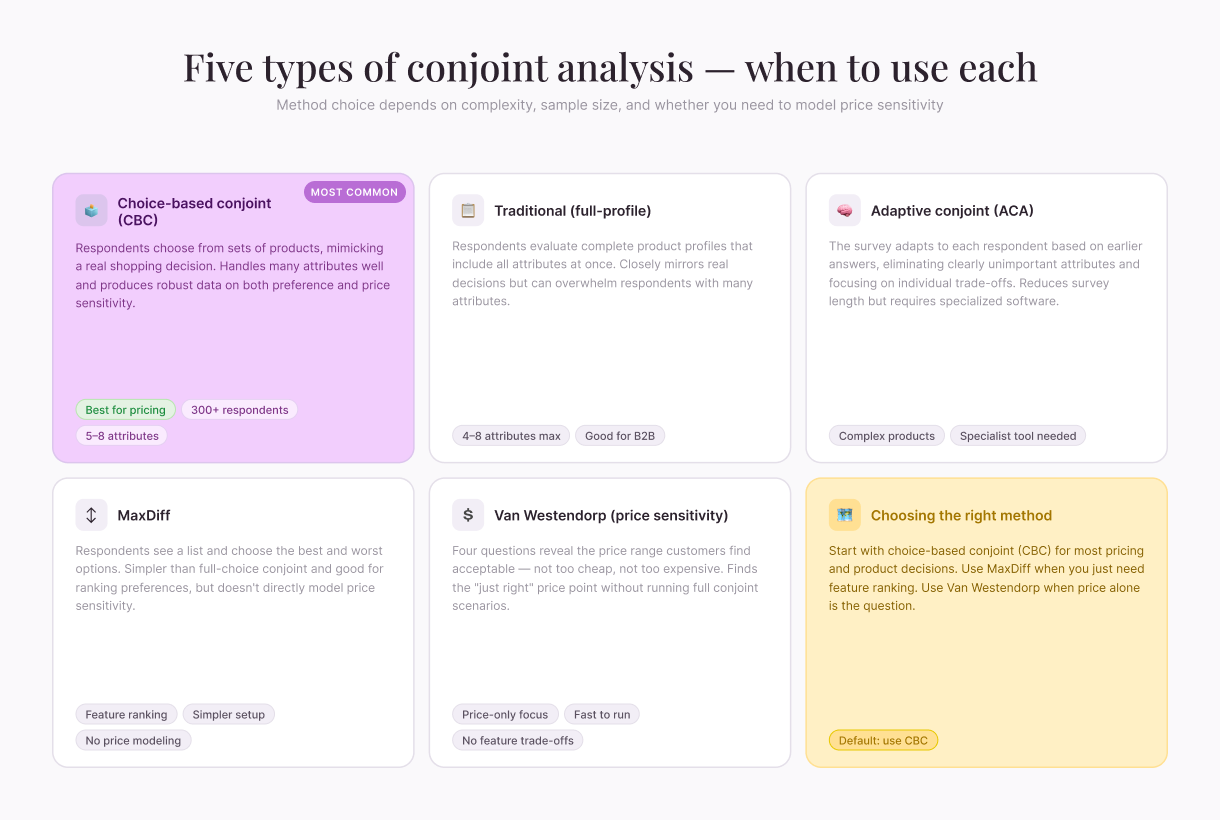
Traditional conjoint (full-profile conjoint). Respondents evaluate full product profiles that include all attributes simultaneously. This mirrors real-world decision-making closely but can overwhelm respondents if you have many attributes. It works best with 4–8 attributes.
Choice-based conjoint (CBC). Respondents choose from sets of products, similar to a real shopping scenario. This method handles many attributes well and produces robust data. It’s become the most popular conjoint method in market research because it better mimics actual purchasing contexts.
Adaptive conjoint analysis (ACA). The survey adapts to each respondent based on their earlier answers. Early questions eliminate clearly unimportant attributes, and later questions focus on the trade-offs that matter to that person. This approach reduces survey length and fatigue but requires specialized software.
MaxDiff (Maximum Difference Scaling). Respondents see a list of options and choose the best and worst. It’s simpler than full-choice conjoint and works well for ranking preferences, but it doesn’t model price sensitivity as directly.
Conjoint Van Westendorp analysis (also called the Price Sensitivity Meter). This focuses specifically on price. Respondents answer four questions about acceptable price ranges, and the analysis reveals the price point that feels “just right”—not cheap, not expensive, but fair.
Each method has trade-offs. Choose based on whether you prioritize realism, simplicity, or specialized insights. For most pricing and product decisions, choice-based conjoint is the default starting point.
When to use conjoint analysis
Conjoint analysis isn’t the right tool for every research question, but it excels in specific scenarios.
Use conjoint analysis when you need to:
- Understand feature priorities and trade-offs in detail
- Test multiple price points and their impact on demand
- Develop new products or refine existing ones
- Identify distinct market segments with different preferences
- Forecast market share under different product configurations
- Determine the value of a feature or add-on
- Guide go-to-market positioning and messaging
Skip conjoint analysis if you:
- Need quick, directional insights
- Have fewer than 100 respondents
- Are testing emotional or brand-perception factors
- Face severe budget constraints
- Are in the very early concept stage, where attributes aren’t yet defined
Conjoint analysis works best after you’ve done foundational research—exploratory interviews, focus groups, or initial surveys—to understand the landscape. Without that groundwork, you risk testing the wrong attributes and producing confidently wrong results.
Real-world applications of conjoint analysis
To better understand conjoint analysis, consider these common real-world application examples:
Software and SaaS pricing. A productivity app runs conjoint analysis on 500 users and tests different pricing tiers, storage limits, collaboration features, and support levels. The analysis shows that collaboration tools drive far more value than storage, so the company redesigns its pricing to bundle advanced collaboration features into mid-tier plans. The company discovers that users would pay 30% more for real-time collaboration than for equivalent storage upgrades.
Consumer packaged goods. A snack company wants to launch a new product line. Conjoint analysis reveals that customers care most about taste, followed by price, then brand reputation. The company invests in product development to ensure taste is exceptional, then sets competitive pricing to maximize volume. Without the study, the company might have spent its launch budget on packaging upgrades that customers barely noticed.
E-commerce platform features. An online retailer tests different combinations of free-shipping thresholds, return windows, and return fees. The study shows that customers value a 30-day return window far more than free shipping over $50. The company extends returns to 30 days and removes the free shipping threshold. Customer satisfaction and repeat purchases increase.
B2B service offerings. A consulting firm uses conjoint analysis to understand what enterprise clients value in service contracts: response time, dedicated account manager, case volume included, and price. Based on these insights, the firm redesigns service tiers to emphasize dedicated accounts and faster response times rather than competing on price alone. The result is better client retention and higher average contract value.
Challenges and limitations of conjoint analysis
Conjoint analysis is powerful, but it’s not magic. Several real-world challenges can affect your results.
Hypothetical bias. Respondents answering survey questions don’t face real consequences. A customer might say they’d buy a $200 product in a conjoint exercise, but behave differently with actual money on the line. The gap between stated and actual behavior can be substantial in high-value purchase contexts. Mitigate this by setting up scenarios that feel consequential—reference realistic product options, actual price points, and believable delivery timelines. Larger samples help average out individual inconsistencies, and adding a small real-money component to a pilot study can calibrate how much hypothetical bias you’re dealing with.
Too many attributes. Include more than 8–10 attributes in a traditional conjoint study, and respondents will struggle to process all the information. Choice-based conjoint handles more attributes better. Start with your most important 5–6 attributes and run a second study if needed.
Attribute definitions. How you describe attributes shapes responses. If “customer support” is vague, respondents interpret it differently. Be specific: “email support within 24 hours” is clearer than “standard support.” Pilot-test your wording with a small group of actual customers before committing to a full study.
Market changes. Conjoint analysis captures preferences at a moment in time. If your market or competitive landscape shifts significantly, the insights fade. Plan to refresh studies every 12–24 months in fast-moving industries.
Segment misalignment. Conjoint analysis often reveals that different customer segments have very different preferences. Use segmentation results to guide product portfolio strategy rather than forcing a one-size-fits-all approach. Running separate analyses for each segment sometimes reveals that “the market” is actually several distinct markets with opposing preferences. A feature that drives most of the value for one segment might barely register for another. If your product can’t be all things to all people, conjoint tells you where to focus.
Interaction effects. In the real world, the value of one feature can depend on another feature. Standard conjoint methods assume attributes are independent. Advanced designs can model interactions, but they require larger samples and specialized expertise to interpret.
How to run a conjoint analysis study
If you decide conjoint analysis is right for your business, here’s a roadmap for execution.
Step 1: Define your research objective. Be specific. “Should we raise our price?” is vague. “What’s the optimal price point for our business plan, and how much would we lose in volume?” is actionable. Write down the top 3 decisions you need to make. A good objective reads like a testable hypothesis: “Customers will pay a 15% premium for faster shipping” is testable. “Our customers want better delivery” is not.
Step 2: Conduct exploratory research. Before designing a conjoint study, conduct interviews, focus groups, or short surveys to understand what attributes matter. Aim for 10–15 interviews or a focus group with 6–8 participants. Skipping this step is a common reason conjoint studies produce unusable results.
Step 3: Select your conjoint method. Based on your complexity, sample size, and timeline, choose traditional, choice-based, adaptive, or MaxDiff conjoint. Choice-based conjoint is the most robust option for most companies.
Step 4: Design your attributes and levels. List 5–8 attributes and 2–4 levels per attribute. Make levels realistic and evenly spaced. Include price as an attribute. Test your wording with a small pilot group.
Step 5: Create your study. Use specialized conjoint software to generate product scenarios and build the survey. The software ensures statistical efficiency by showing respondents a balanced, manageable set of scenarios.
Step 6: Recruit your sample. Aim for at least 300–500 respondents. Target your actual customer base or target market. Quota your sample to ensure representation across important segments. Budget for incentives: consumer studies commonly offer $5–20 per completed response, and B2B studies often require $50–200. Skimping on incentives tanks completion rates and biases your sample toward people with too much free time, which usually isn’t the audience you’re trying to understand.
Step 7: Run the survey and analyze results. Launch your study and collect responses over 1–2 weeks. Once data is collected, the software produces part-worth utilities, importance scores, and price sensitivity curves. Check your data for quality: filter out “straight-liners” who chose the same option every time, and review completion rates for signs of survey fatigue. Expect to lose 5–15% of raw responses to data cleaning.
Step 8: Segment and interpret. Look for differences across customer segments. Do enterprise customers value different features than mid-market? Segmentation often reveals more actionable insights than aggregate results.
Step 9: Validate and iterate. If possible, test your recommendations with a small group or pilot market before rolling them out company-wide. Real-world results sometimes differ from survey predictions due to hypothetical bias or market factors you didn’t anticipate.
Step 10: Plan for refresh. Mark your calendar to run a follow-up study in 12–24 months. Market preferences shift, competitors launch new offerings, and your product evolves.
Conjoint analysis vs. other research methods
Conjoint analysis isn’t the only way to understand customer preferences. Here’s how it compares to related methods.
Conjoint analysis vs. surveys and questionnaires. Surveys ask direct questions (“How important is feature X?”). Conjoint analysis asks respondents to make choices that reveal implicit priorities. Surveys are faster and cheaper; conjoint analysis is more accurate about what customers will actually do. A complete research strategy often combines both.
Conjoint analysis vs. focus groups. Focus groups are qualitative and exploratory—great for understanding why customers care about certain features. Conjoint analysis is quantitative and confirmatory—great for measuring the magnitude of preferences. Run focus groups first to identify attributes, then use conjoint to quantify them.
Conjoint analysis vs. A/B testing. A/B testing shows what actually happens when you change something (real behavior). Conjoint analysis predicts what would happen under hypothetical scenarios (stated behavior). Use A/B testing to validate high-stakes decisions after you’ve narrowed your options with conjoint analysis.
Conjoint analysis vs. interviews. In-depth interviews uncover rich, contextual insights about customer needs. Conjoint analysis measures preferences quantitatively across a large sample. Interviews are better for discovery; conjoint is better for validation and quantification.
Getting started with conjoint analysis
Conjoint analysis can seem technical and daunting, but the core idea is simple: understand customer trade-offs by asking them to make realistic choices, then use their choices to guide product and pricing decisions.
The method works because it mirrors how customers actually decide. In real life, people choose products based on a bundle of attributes at a given price. Conjoint analysis recreates that decision-making process in a research setting, giving you reliable data to inform strategy.
If you’re about to redesign your product, test a new price point, or launch a new offering, conjoint analysis deserves serious consideration. It’s not a quick survey, and it requires thoughtful design. But the clarity it provides about what your customers truly value makes the investment worthwhile. You’ll likely find that the insights pay back the research cost many times over through sharper product decisions and better pricing.
Common first-timer mistakes include including too many attributes, defining levels too vaguely, or skipping the exploratory phase. So, resist the urge to test everything at once. A focused study with 5 well-defined attributes produces better decisions than a bloated one that tries to cover every possibility.
Start by defining your core research question. What specific decision do you need to make? What attributes matter most? Once you have those answers, you’ll know whether conjoint analysis is the right tool—and how to run a study that delivers actionable insights.