Rating scale surveys: Types, examples, and how to use them
A rating scale survey asks people to evaluate something on a defined spectrum. Instead of yes or no, respondents pick a point—say, 1 to 5, or “strongly disagree” to “strongly agree”—to express the intensity of an opinion or experience.

A rating scale survey asks people to evaluate something on a defined spectrum. Instead of yes or no, respondents pick a point—say, 1 to 5, or “strongly disagree” to “strongly agree”—to express the intensity of an opinion or experience.
Rating scales are everywhere in customer research. They measure satisfaction, likelihood to recommend, agreement, or how often something happens. They’re simple to create and analyze, which is why teams reach for them when they need structured feedback fast.
This guide covers the main types of rating scales, when to use each, and how to design questions that yield useful data.
Why rating scales matter
Rating scales turn subjective opinion into quantifiable data. “I’m satisfied” is helpful but vague. A 4 on a 5-point scale is a number you can track, compare, and analyze.
That structure is the power. Scales force a choice. They’re quicker than open text. And because the format is consistent, you can ask multiple related questions and spot patterns.
For example:
- How satisfied are you with our product?
- How satisfied are you with our customer support?
- How satisfied are you with our pricing?
Same scale, three answers. You instantly see where customers feel strongest and where the work is.
The most common types of rating scales
To understand how to use rating scales effectively, it’s helpful to know the different types and what each is best suited for.
Likert scales
A Likert scale asks respondents to choose a position on a range from one extreme to its opposite, often with a neutral middle.
Common Likert formats:
- Strongly disagree, disagree, neutral, agree, strongly agree
- Very unsatisfied, unsatisfied, neutral, satisfied, very satisfied
- Never, rarely, sometimes, often, always
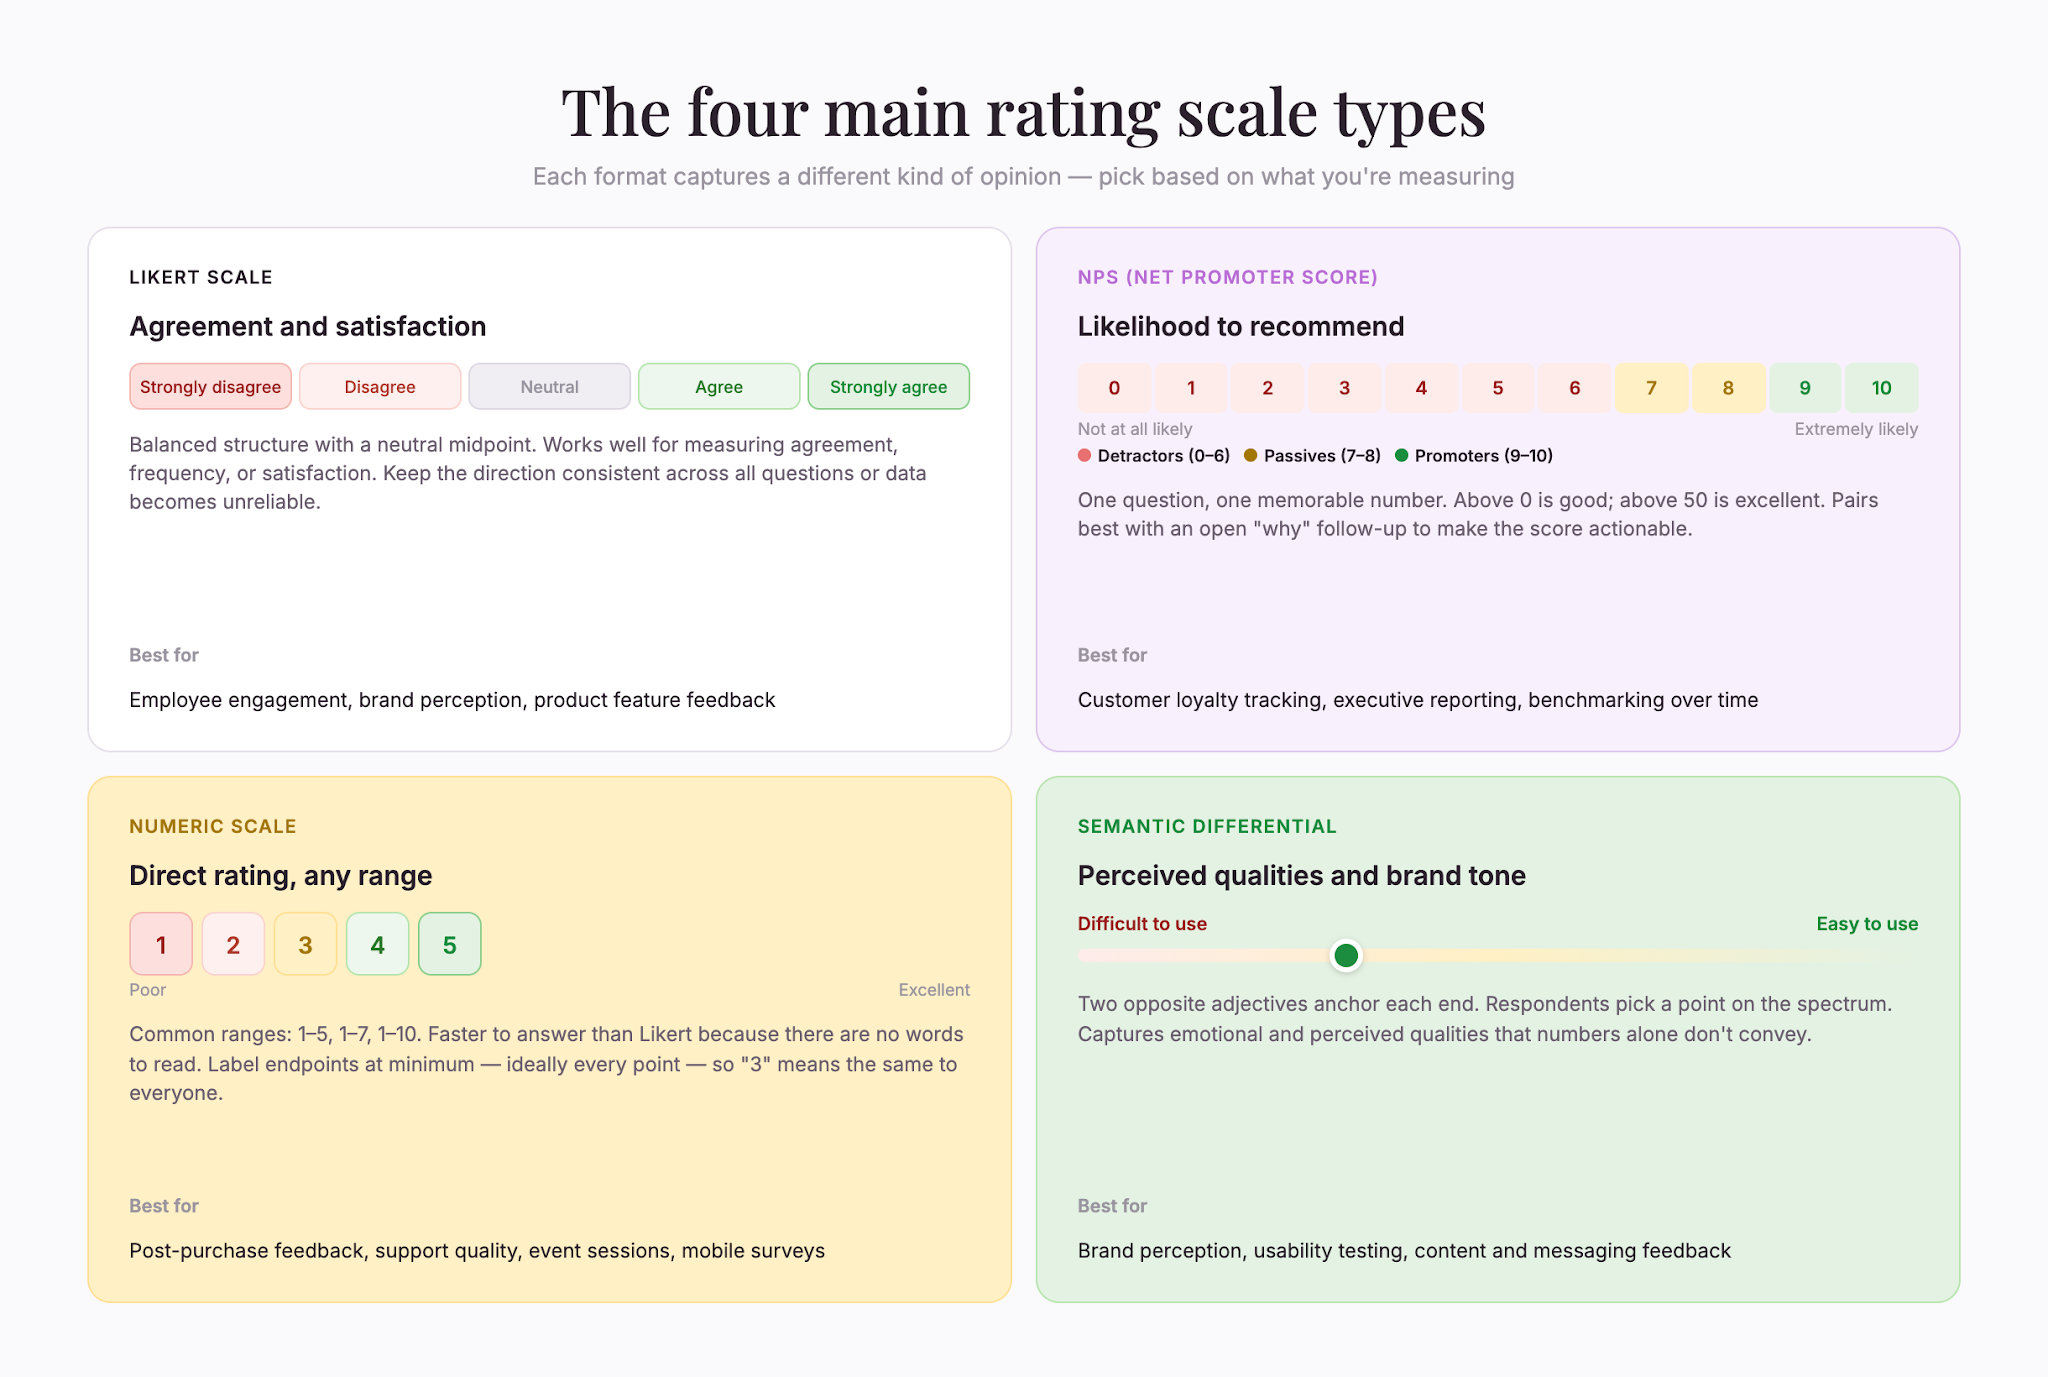
Likert scales work well for agreement, satisfaction, or frequency. The balanced structure (equal points on either side of neutral) feels fair to respondents.
One thing to watch: stay consistent. If 5 means “strongly agree” on one question, it should mean the same on every following question. Mixing directions confuses people and taints the data.
Net Promoter Score (NPS)
NPS is a deceptively simple question: “How likely are you to recommend us to a friend or colleague?”
Respondents answer on 0–10. Scores of 9–10 are promoters; 7–8 are passives; 0–6 are detractors. Subtract the detractor percentage from the promoter percentage and you get a number between -100 and 100.
Above 0 is generally considered good. Above 50 is excellent. Many industries average between 30 and 40.
NPS is popular because it’s a single, memorable metric that’s easy to communicate to stakeholders (“Our NPS is 42”). It also tracks loosely with retention and growth, though it doesn’t tell the whole story of customer experience on its own.
Numeric rating scales
A numeric scale asks for a number, usually 1–5, 1–10, or 0–100.
Example: “Rate your experience on a scale of 1 to 5, where 1 is poor and 5 is excellent.”

Numeric scales answer faster than Likert because there are no words to read. They also fit well on mobile. The trade-off? A number alone can feel abstract. Does “3” mean the same to everyone? Adding labels at the endpoints (or across all points) can help a lot here.
Semantic differential scales
A semantic differential scale puts two opposite words at either end. Respondents pick a point between them.
Example: “This form is easy to use” —— (respondent picks a point) —— “This form is difficult to use”
These work well for emotional or perceived qualities. They’re less common in standard customer surveys but useful for brand perception, usability testing, and content feedback.
How to construct a strong rating question
Rating scales can provide you with valuable information, but only if you ask the right questions, the right way.
Ensure clarity with a statement
“How satisfied are you with the speed of our customer support?” is clear and specific. “Do you like how we are?” is vague and yields unreliable data.
For a Likert scale, phrase it as a statement: “I would recommend this product to a friend.” Then pair with “Strongly agree” to “Strongly disagree.”
For a direct question (NPS or numeric), use plain English. Avoid jargon and loaded language. “How much do you agree that our product is cutting-edge?” sounds like a setup. “How would you rate our product’s performance?” is neutral.
Choose the right scale length
Common lengths include 3, 5, 7, and 10 points. Here’s what sets them apart:
- 3-point – Fast, forces a clear choice, but no nuance
- 5-point – Most common; differentiates opinion without overwhelming
- 7-point – More granularity, popular in academic research, but respondents often struggle with a 4 versus a 5
- 10-point – Maximum range, works when the anchor (like NPS) gives the scale meaning
[GRAPHIC: A horizontal comparison chart showing four rating scales (3-point, 5-point, 7-point, 10-point) side by side with typical labels, illustrating increasing granularity]
Use verbal anchors or icons
Don’t make respondents guess what a number means. Label your endpoints, and ideally every point.
For instance, instead of: “Rate your satisfaction: 1 2 3 4 5,” try:”Very unsatisfied, Unsatisfied, Neutral, Satisfied, Very Satisfied.”
Icons work too. A row of faces from frowny to smiley, or stars from empty to full, communicates the scale without words. Icons are especially helpful on mobile and for international audiences.
Keep your scales consistent
If you use multiple rating questions, keep the direction and length the same. Flipping the direction mid-survey introduces error and can frustrate respondents.
Reconsider the neutral option
The middle option on a Likert scale—“neutral”—sounds thoughtful but can be a crutch. Respondents who don’t want to think pick it.
If your goal is to separate satisfied from dissatisfied, drop the neutral and use a 4-point scale. You’ll force a lean and get clearer data.
Keep the neutral when you genuinely expect some respondents to have no opinion. Just know it’ll attract clicks.
Common mistakes
To ensure accurate data, avoid these common mistakes:
- Combining ideas in one question. “I find this product easy to use and worth the price” mixes two concepts. Split it.
- Vague language. “This product is good” doesn’t tell you what’s being rated. “This product is reliable” is specific.
- Mismatching scale to question. “How often do you use this feature?” needs a frequency scale, not a satisfaction scale.
- Leading questions. “Don’t you agree our support is fantastic?” nudges toward yes. Ask “How would you rate the quality of our support?”
- Skipping the test. Fill out your own survey on desktop and mobile. If a question confuses you, it’ll confuse respondents.
Analyzing rating scale data
Analysis depends on the type of rating scale you use.
For Likert scales:
- Report the percentage choosing each option
- Convert to numbers (1–5) and calculate a mean—“4.2 out of 5” is a clean way to communicate sentiment
- Compare groups with statistical tests like ANOVA when you need rigor
For NPS, calculate promoter, passive, and detractor percentages, then subtract.
For numeric scales, report distribution and average. “Customers rated checkout 4.3 out of 5, with 68% giving a 4 or 5.”
The most important habit: track results over time. A single score is interesting, but a trend is actionable. If your average satisfaction was 4.1 last quarter and 3.8 this quarter, something shifted. Find out what.
Real-world examples
When’s the best time to use rating scale surveys?
- Customer satisfaction. Retailers often ask in-store shoppers to rate their experience on 1–5 scale right after checkout. Managers then use the data to spot which locations need attention.
- Product feedback. Software teams ask users how easy a new feature is, how useful it is, and whether they want it improved. Quick numeric ratings capture first impressions without demanding essays.
- Employee engagement. HR teams use Likert statements like “I have the tools I need to do my job” and “I feel valued by my manager.” These aggregated scores show where culture needs work.
- Market research. Researchers use semantic differential scales for brand perception—“innovative–traditional,” “trustworthy–risky,” “premium–budget.” The pattern creates a brand profile.
- Event feedback. Conference organizers often send post-event surveys that rate event sessions, venue, food, and networking on a 5-point scale. The aggregate data can then guide next year’s plan.
Rating scales versus other question types
Rating scales aren’t the answer to every question.
Use rating scales when you want:
- Quick, structured feedback
- Data you can compare period over period or location over location
- A blend of structured and open feedback, when paired with a follow-up
Use open-ended questions when you want:
- Detailed, narrative feedback
- To uncover themes you didn’t anticipate
- The “why” behind a rating
Many strong surveys use both. Ask for the rating, then “Can you tell us more?” That gives you the number and the story.
Final takeaway
Rating scales are a cornerstone of feedback collection. They’re quick to answer, easy to analyze, and flexible enough to measure satisfaction, agreement, likelihood, frequency, or perception.
The key is care in design. Be specific about what you’re measuring. Keep scales consistent. Use clear anchors. Test before you send.
Nail the fundamentals, and rating scales will give you the structured data you need to spot patterns, make confident decisions, and track change over time.