Survey design: Best practices and 15 expert tips
Master survey design with 15 expert tips on question types, framing bias, conditional logic, and sample size to get reliable data people actually complete.
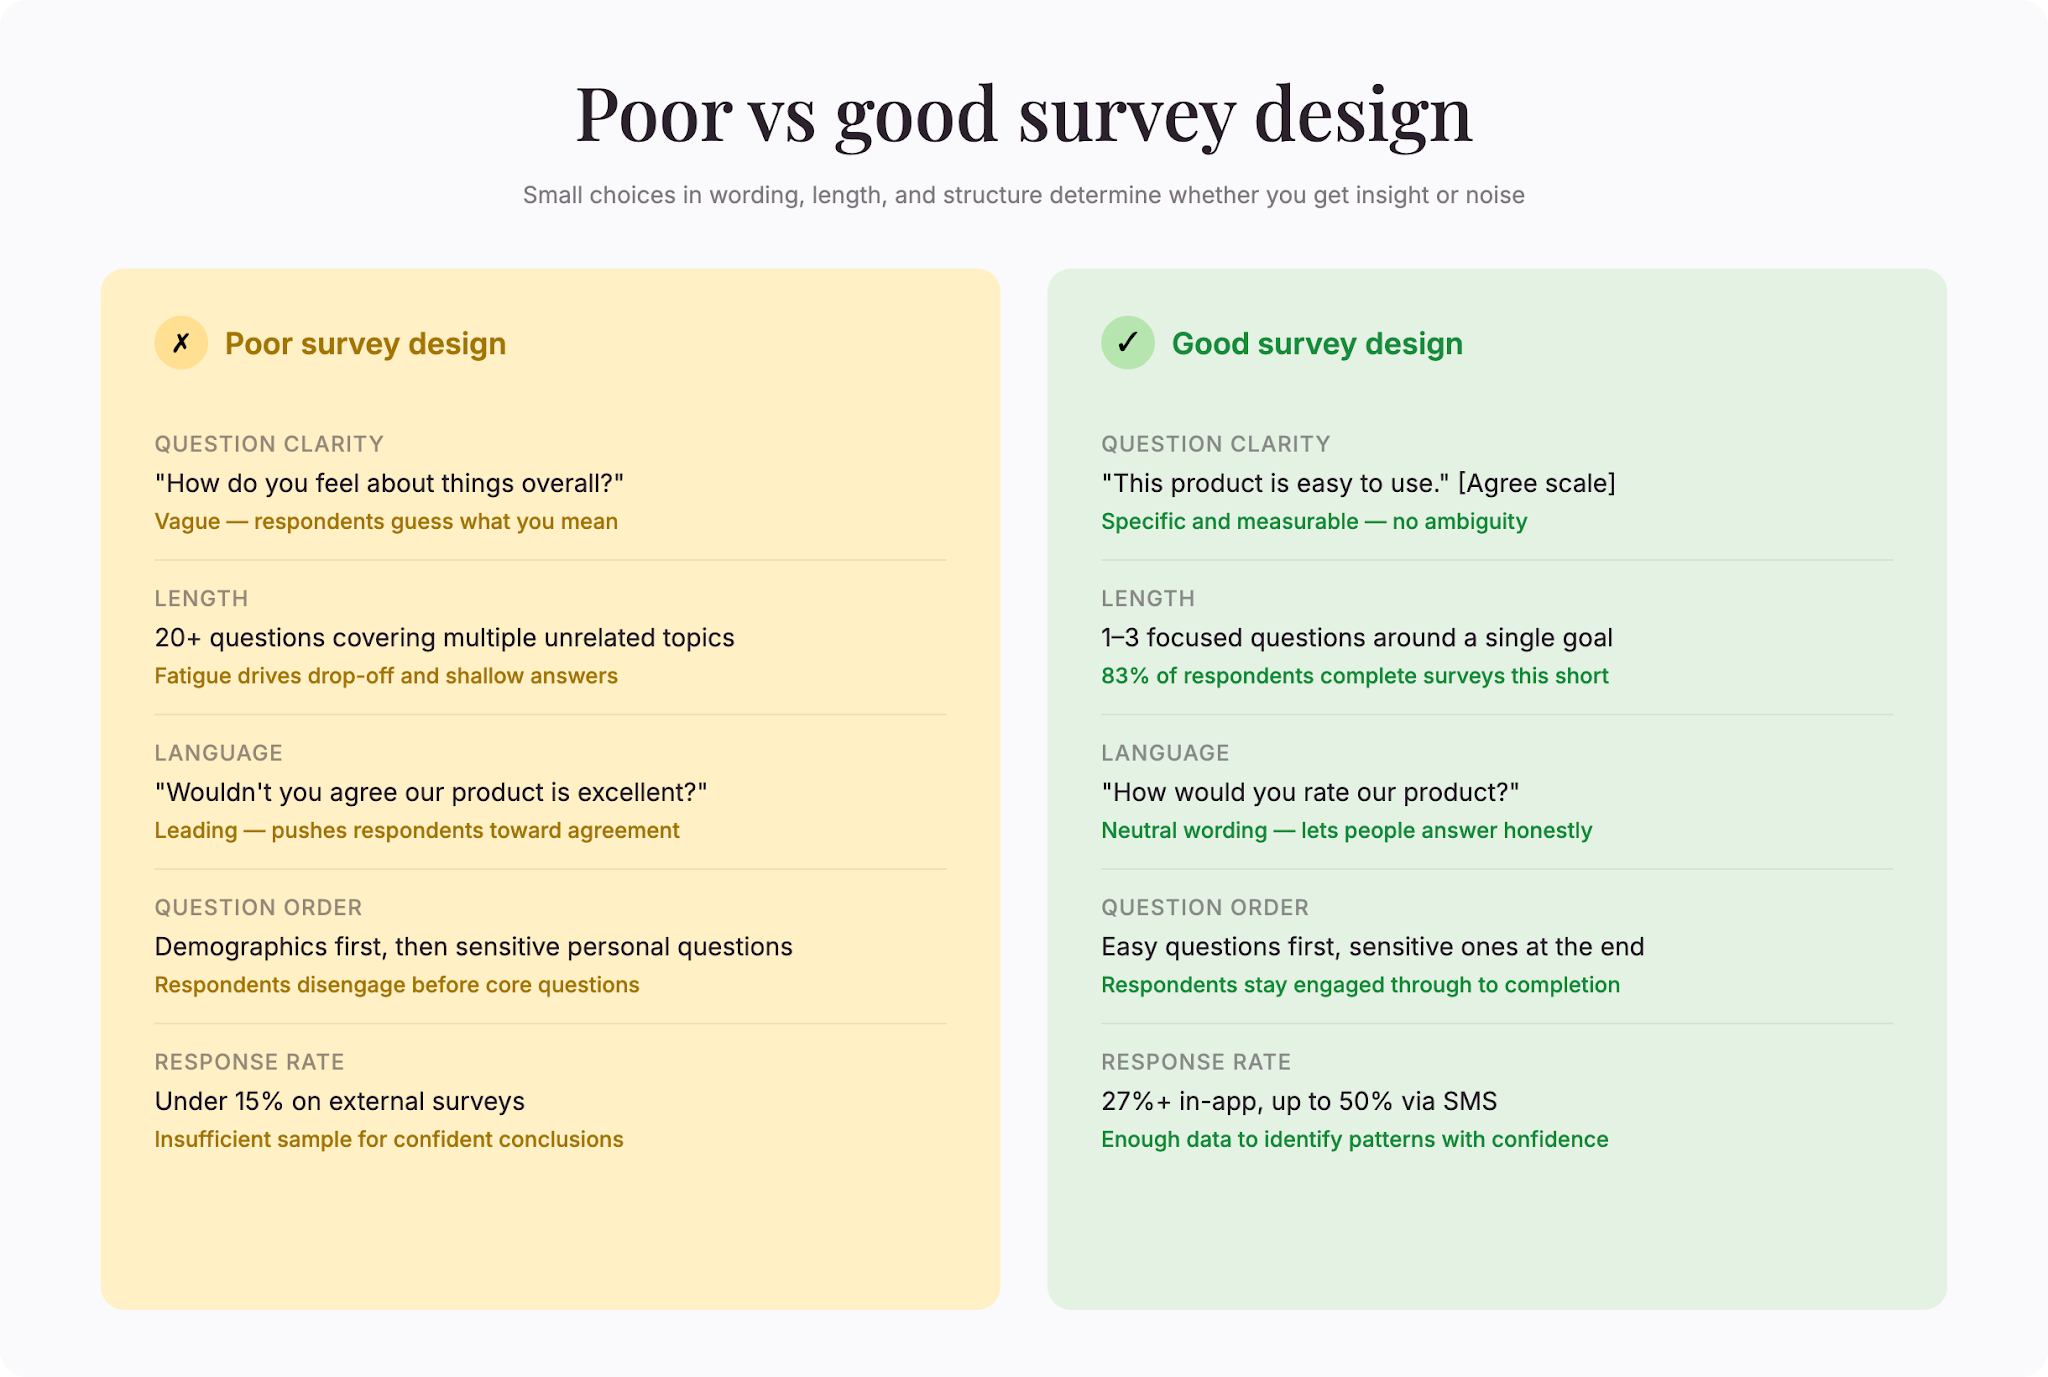
A well-designed survey gets honest answers from real people. A poorly designed one wastes everyone’s time and produces unreliable data that points you in the wrong direction.
The difference usually comes down to small choices: how you phrase a question, where you place it, and how you handle sensitive topics. This guide covers survey design best practices and 15 actionable tips that help you build surveys people actually finish.
What makes survey design matter
Online surveys are the most used quantitative method among market research professionals, with 85% using them regularly (Backlinko, 2026). They’re fast, scalable, and cheap. But anyone can build one, and most do it badly. Poor design introduces bias, confusion, and nonresponse. Good design anticipates those problems, respects the respondent’s time, and structures the flow so people stay engaged.
The foundation: keep surveys short
Length is the single biggest driver of completion: Surveys with 1–3 questions are completed by 83.34% of respondents (SurveySparrow, 2025). Every question beyond that costs you. When surveys run long, people give shorter, less reliable answers, then skip or abandon. Expect 20–30% response rates for external digital questionnaires (SurveySparrow, 2025), with significantly higher numbers when the survey runs under 3 minutes.
Before writing a single question, ask: What do I absolutely need to know? Cut everything else. If you need a lot of information, run multiple short surveys instead of one long one.
15 expert tips for better survey design
1. Use the right question type for your goal. Yes/no questions are fast, reduce fatigue, and produce easy categorical data (piHappiness, 2024). Dichotomous questions have two options—Yes/No, Agree/Disagree, True/False (SurveySparrow, 2024). Use them for screening or simple facts. Use Likert scales for opinions and experiences. Use open-ended sparingly—they’re rich but harder to analyze.
2. Avoid the framing effect. Wording shapes answers. People avoid risk when options are positively framed and seek risk when negatively framed (Frontiers in Psychology, 2020). “Prefer a brand with a 95% satisfaction guarantee?” hits differently from “Avoid brands with a 5% dissatisfaction rate?” Test wording on a small group; vary option order.
3. Place open-ended questions carefully. Open-ended follow-ups on the same page as the source question raise item nonresponse by more than 25 percentage points (Hadler, 2025). Put follow-ups on a separate page to give respondents a visual break.
4. Order questions logically. Start easy. Demographics and screeners first, then core topics. Save sensitive questions for the end, once respondents have invested time. Group related items so respondents stay in the same mental space.
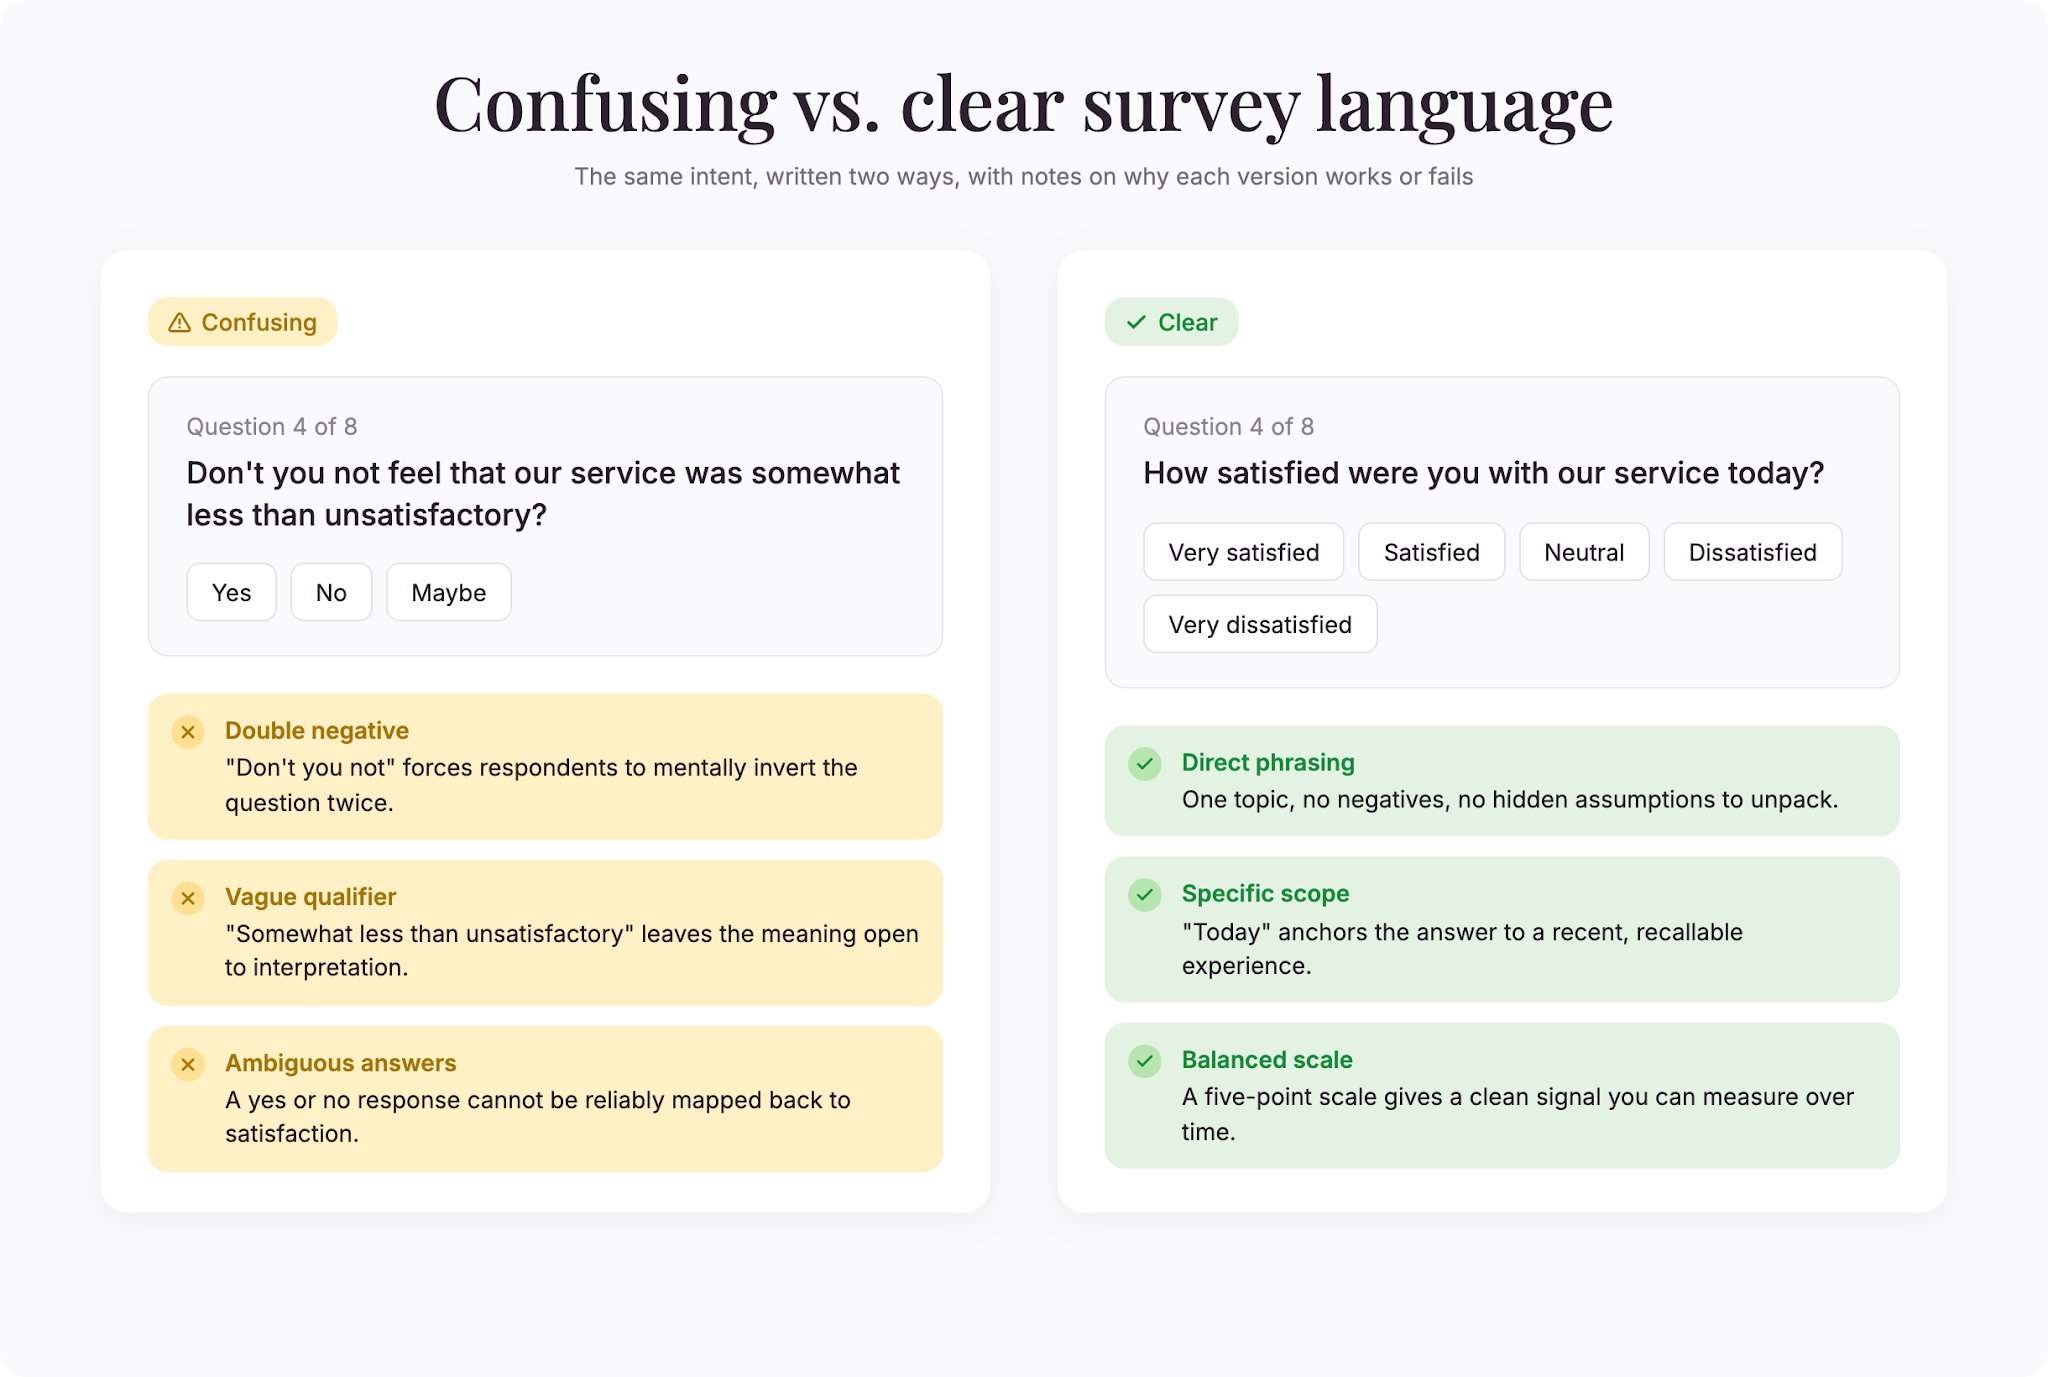
5. Avoid leading language. Don’t ask “Don’t you agree our product is excellent?” Ask “How would you rate our product?” Skip absolutes like “always” and “never” unless you actually need binary data.
6. Watch for acquiescence and social desirability bias. Acquiescence bias is the tendency to agree regardless of content. Social desirability bias is overreporting good behavior on sensitive questions (Qualtrics, 2025). Assure anonymity, frame sensitive items neutrally, and offer middle options on Likert scales.
7. Keep language simple. Skip jargon and acronyms. Define technical terms. Read questions aloud—if they sound awkward, they’ll confuse respondents.
8. Match question to scale. If “1” is “very unsatisfied” in one question, keep it that way in the next. Don’t flip scales.
9. Pilot before launch. Test with 10–20 people from your target audience. Watch where they pause, skip, or get confused. If your survey takes 15 minutes but you promised 5, respondents feel deceived.
10. Use conditional logic. Skip car-related questions for people who don’t own a car. Conditional logic makes surveys feel shorter because respondents only see what’s relevant.
11. Make instructions crystal clear. If “check all that apply” allows multiple answers, say so explicitly. If you need a specific format, show an example.
12. Avoid double-barreled questions. “Are you satisfied with quality and customer service?” can’t be answered honestly by anyone who loves one and hates the other. Split it.
13. Account for AI-assisted responses. 34% of online research panel respondents reported using LLMs to help answer open-ended survey questions, raising data-homogenization concerns (Zhang, Xu, Alvero, 2025). Add follow-ups that probe depth of thought, or use response patterns to flag suspicious data.
14. Plan sample size. Acceptable margin of error is typically 3–6% at 95% confidence (Qualtrics, 2025). Decide your margin first, then calculate the responses needed. To survey 500,000 people at 95% confidence with 5% margin, you need 384 responses (Qualtrics, 2025).
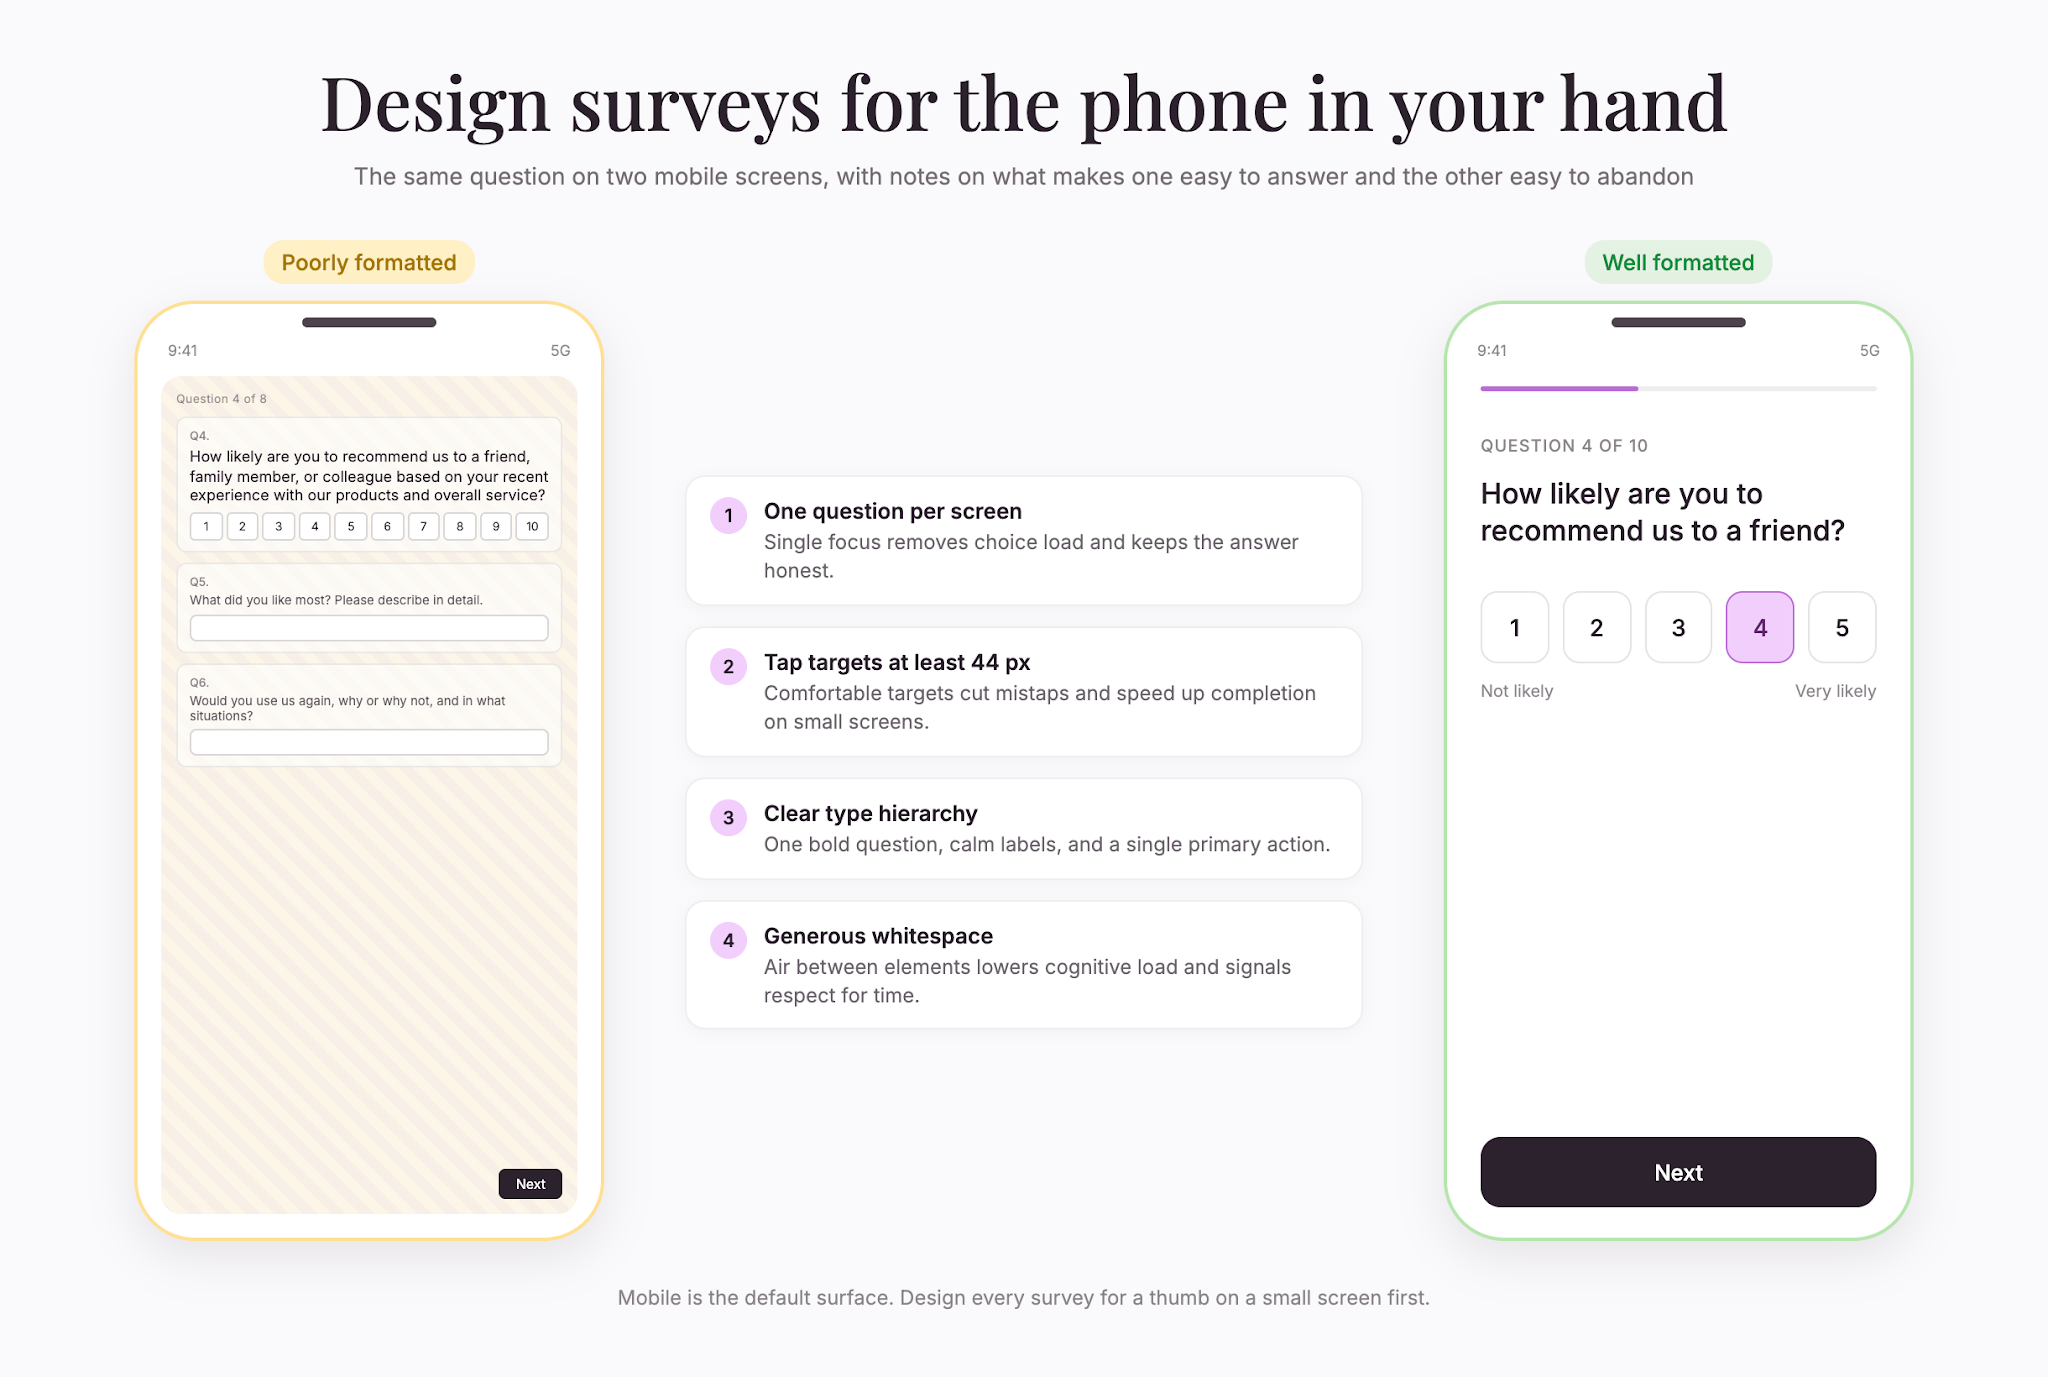
15. Make it mobile-friendly. Many respondents take surveys on phones. Test on multiple devices before launch—cut-off questions kill completion.
Common mistakes to avoid
- Asking for information that respondents can’t possibly know
- Mixing positive and negative answer options inconsistently
- Using vague response labels like “sometimes” or “often”—they mean different things to different people
- Assuming people remember details they actually forgot
- Overloading the survey with unrelated topics
Building a better survey
Good survey design is iterative. Start with a hypothesis, write questions, test with real respondents, revise, then launch. Time invested upfront pays back in data quality and confidence in your conclusions. A short, clear, well-structured survey gets honest answers fast.
Start with your core questions, keep it short, pilot with real people, and refine before launch.
That’s the foundation of survey design that works.

.png)