Demographic survey questions: 18 examples and best practices
Get 18 demographic survey questions covering age, income, education, and location, plus best practices on phrasing, sensitive topics, and sample size planning.
Demographic questions are the backbone of effective research. They tell you who your respondents are—their age, location, income, education, employment status, and more. Without solid demographic data, you can’t segment your findings, spot trends across groups, or judge whether your sample represents your target population.
But asking them isn’t as simple as it sounds. Phrasing, options, and order all shape how people answer. Get it wrong, and you get incomplete data, confused respondents, or abandonment.
This guide walks through 18 demographic survey questions, what makes them work, and how to avoid common pitfalls.
Why demographic questions matter
Good demographic data does three things. It tells you who answered your survey, so you can judge whether feedback represents your target market. It lets you segment results: an overall 7 out of 10 looks different when 25–34-year-olds score it 8 and 55+ respondents score it 5. And it validates your sample against the population you’re studying.
Online surveys are the most used quantitative method in market research, with 85% of professionals using them regularly (Backlinko, 2026), but only representative samples deliver reliable insight.
The hidden complications
Demographic questions feel easy, which is the trap. People rush through them, misremember ages, or misstate income. On sensitive topics, they underreport the truth—that’s called social desirability bias, where respondents overreport good behavior and underreport bad (Qualtrics, 2025). Acquiescence bias is the related tendency to agree with statements regardless of content (Qualtrics, 2025); across 860,000+ respondents in 20 countries, it ranged from under 3% in Japan, Norway, and Denmark to 13–15% in Israel, India, and China (Latana, 2025).
The takeaway? Frame yes/no demographic questions carelessly, and your results skew without warning. But the fix is simple: clear, non-threatening, hard-to-misinterpret wording.
Consider the examples below.
18 demographic survey question examples
Age and geography
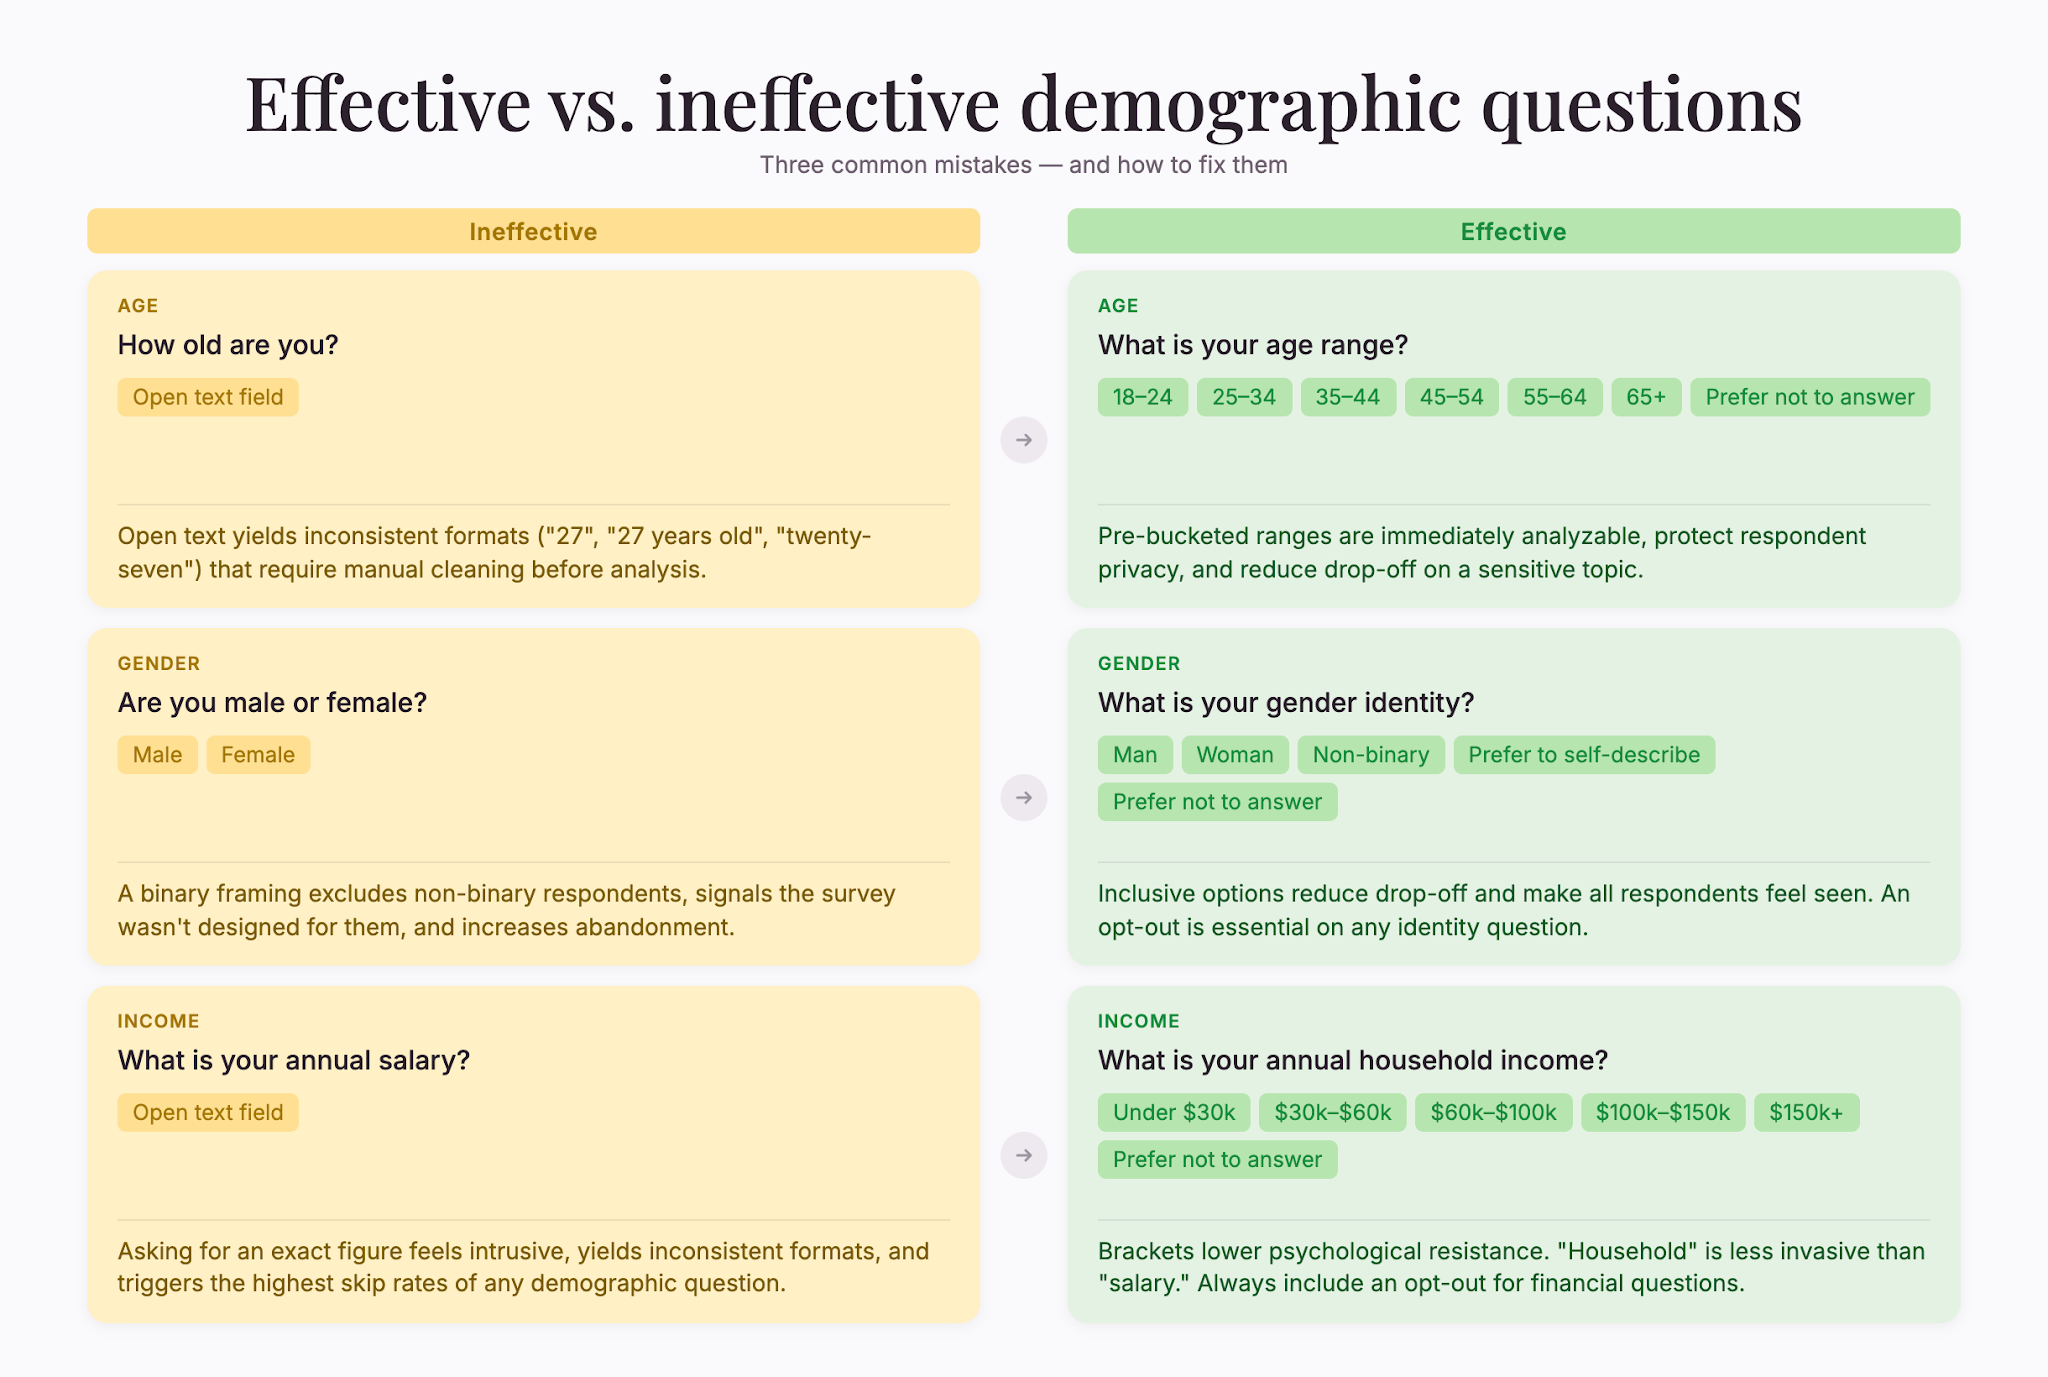
- How old are you? — 18–24 / 25–34 / 35–44 / 45–54 / 55–64 / 65+. Fast, comparable across cohorts.
- Which generation do you identify with? — Gen Z / Millennial / Gen X / Boomer / Silent. Useful when generational identity matters more than raw age.
- What year were you born? — Open text. Precise but slower; reserve for studies that need exact age.
- Country of residence — dropdown with all countries. Prevents typos.
- State or province — dropdown or search field for single-country studies.
- Residential area — Urban / Suburban / Rural / Remote. Captures lifestyle and access factors that a country field can’t.
Income and employment
- Annual household income (before taxes) — bracketed (Under $25K, $25K–$49,999, $50K–$74,999, $75K–$99,999, $100K–$149,999, $150K+) with a “Prefer not to answer” option. Brackets protect privacy and the opt-out reduces social desirability bias.
- Current financial situation — Struggling / Getting by / Financially secure / Wealthy. Subjective, but perceived status often predicts behavior better than raw income.
- Employment status — Employed full-time / Part-time / Self-employed / Unemployed (looking) / Unemployed (not looking) / Retired / Student / Unable to work.
- Industry — dropdown of major industries. Critical for B2B work; standardizes responses.
- Job title or role — open text. Lets respondents describe themselves; needs coding afterward.
Education and household
- Highest level of education — High school / Some college / Associate’s / Bachelor’s / Master’s / Doctoral, plus “Prefer not to answer.” Recognizable brackets.
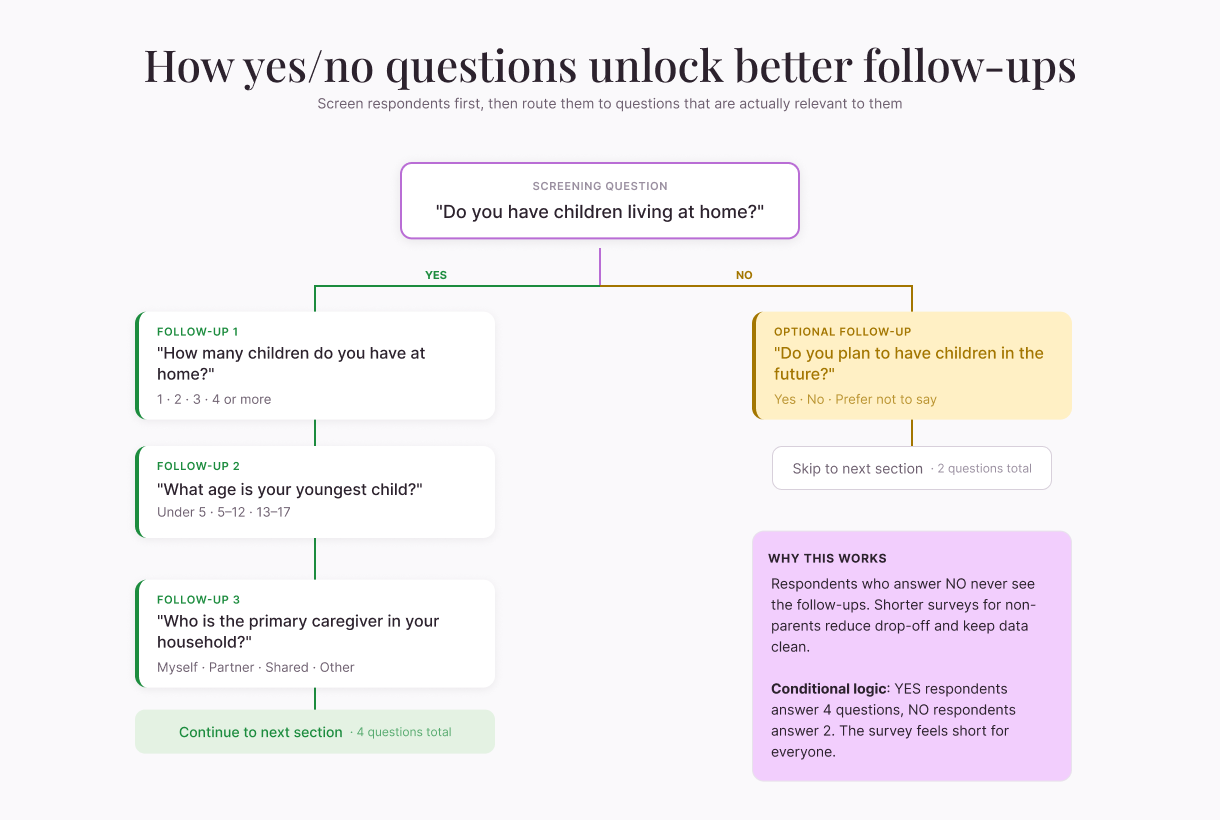
- Currently a student? — Yes / No. Simple and objective. Yes/no items are fast and reduce fatigue, but can oversimplify (piHappiness, 2024)—pair with a follow-up if you need part-time/full-time or field of study.
- Marital status — Single / Married or domestic partnership / Divorced / Widowed / Prefer to self-describe / Prefer not to answer. Modern phrasing.
- Number of children — None / 1 / 2 / 3 / 4+.
- Household size — 1 / 2 / 3 / 4 / 5+. Correlates with spending and time use.
Language and identity
- Primary language — dropdown. Important for multilingual populations and survey-language fluency checks.
- Member of a marginalized or underrepresented group? — Yes / No / Prefer to self-describe / Prefer not to answer. Sensitive; always include the opt-out, and consider category checkboxes for self-identification instead of forced disclosure.
Best practices
Keep them brief and early. Short surveys with 1–3 questions are completed by 83.34% of respondents (SurveySparrow, 2025). Demographics should warm respondents up, not dominate the survey.
Use clear, neutral language. “What is your annual household income (before taxes)?” beats “How much money do you make?” Define terms like “household” and “annual.”
Avoid leading or judgmental phrasing. “How would you describe your current financial situation?” gives a range; “Do you struggle financially?” implies hardship.
Always include “Prefer not to answer” on sensitive items. It reduces bias and lifts completion.
Group related questions together so respondents stay in the same mental space.
Test order and wording. Some teams place income after lifestyle questions to build rapport. Pilot with a small group first.
Match format to data needs. Yes/no questions produce easy categorical data (piHappiness, 2024) but oversimplify (SurveySparrow, 2024); use multiple choice when nuance matters.
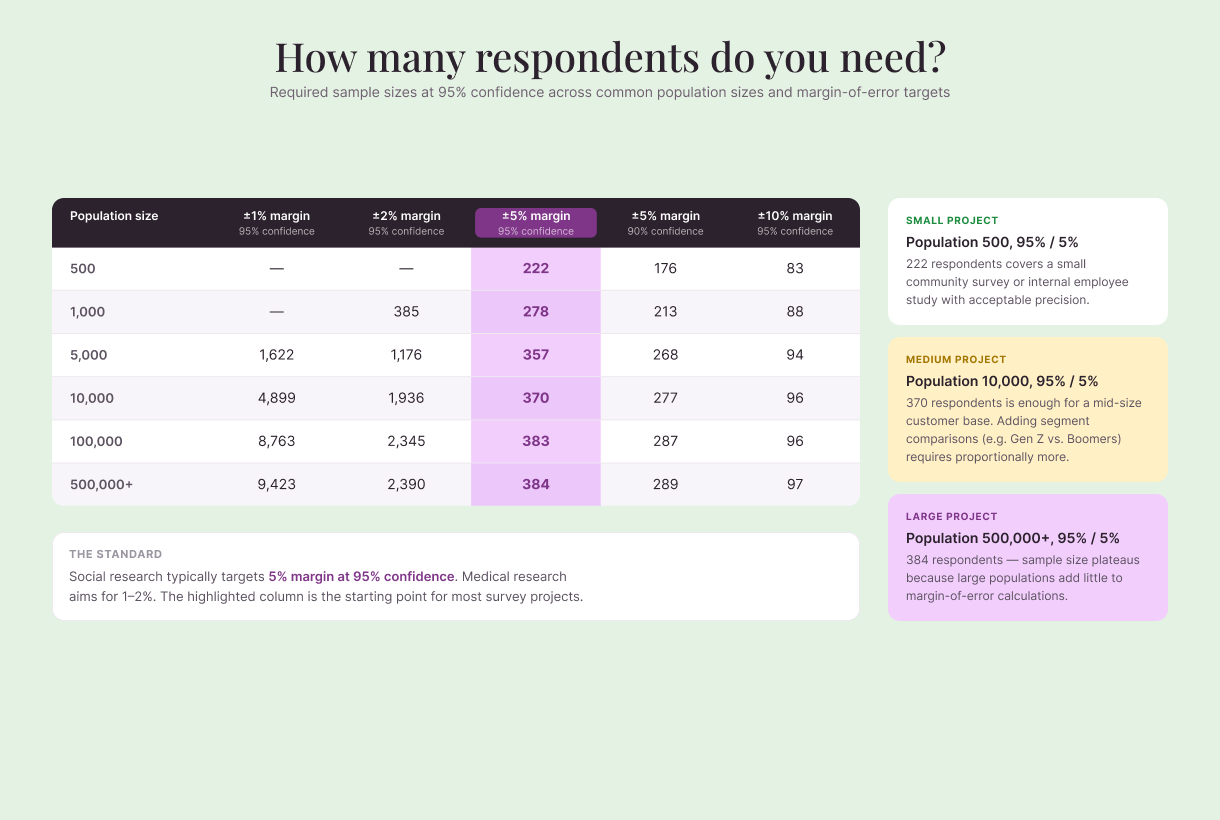
Plan your sample. Acceptable margin of error is typically 3–6% at 95% confidence—around 5% in social research, 1–2% in medical. To survey a population of 500,000 at 95% confidence with 5% margin, you need 384 respondents (Qualtrics, 2025). If you also want to compare Gen Z against Boomers, plan for a much larger total to keep that margin within each segment.
When to use demographic data
You don’t always need every demographic. A pulse survey on a recent product update might only need age range and role. Exploratory interviews matter less because samples are purposeful, not representative. But for launching a product, testing demand, or making strategic decisions, demographics are essential—they tell you which segments your findings apply to and where to focus.
The takeaway
Demographic questions translate raw responses into actionable insights. Ask them clearly, keep them brief, and always let respondents skip sensitive items. Pair yes/no items with follow-ups when you need detail, and test order before launch.
Done right, demographics can turn a pile of responses into a story about who your customers really are.

.webp)
